
Investors looking for high-growth possibilities often mix detailed technical study with solid fundamental momentum filters. The method used here employs Mark Minervini's Trend Template to find stocks in strong uptrends, then adds a High Growth Momentum (HGM) score to confirm these technically good companies also display the fast earnings and sales growth typical of market leaders. This two-part method tries to find stocks with both the price momentum and fundamental strength to possibly produce large gains.
A Good Technical Base
Barrick Mining Corp (NYSE:B) shows a positive technical setup that matches well with the Minervini Trend Template. This template is made to find stocks in clear Stage 2 uptrends, steering clear of the problems of stocks that are consolidating or falling. Barrick's chart displays the exact arrangement of moving averages and price movement that Minervini's work links with future high performers.
Important technical points met by Barrick include:
- Price Above Important Moving Averages: The present price is trading notably higher than the increasing 50-day, 150-day, and 200-day simple moving averages.
- Moving Average Order: The 50-day SMA is positioned higher than the 150-day SMA, which is also higher than the 200-day SMA, verifying a solid and structured uptrend across various time periods.
- Nearness to Highs: The stock is trading within 25% of its 52-week peak, showing it has the momentum common in market leaders, not poorer performers.
- Better Relative Strength: With a ChartMill Relative Strength score of 96.81, Barrick is doing better than most of the market, a required feature for Minervini, who focuses on buying the best stocks, not the most affordable ones.
Fundamentals Fueling the Momentum
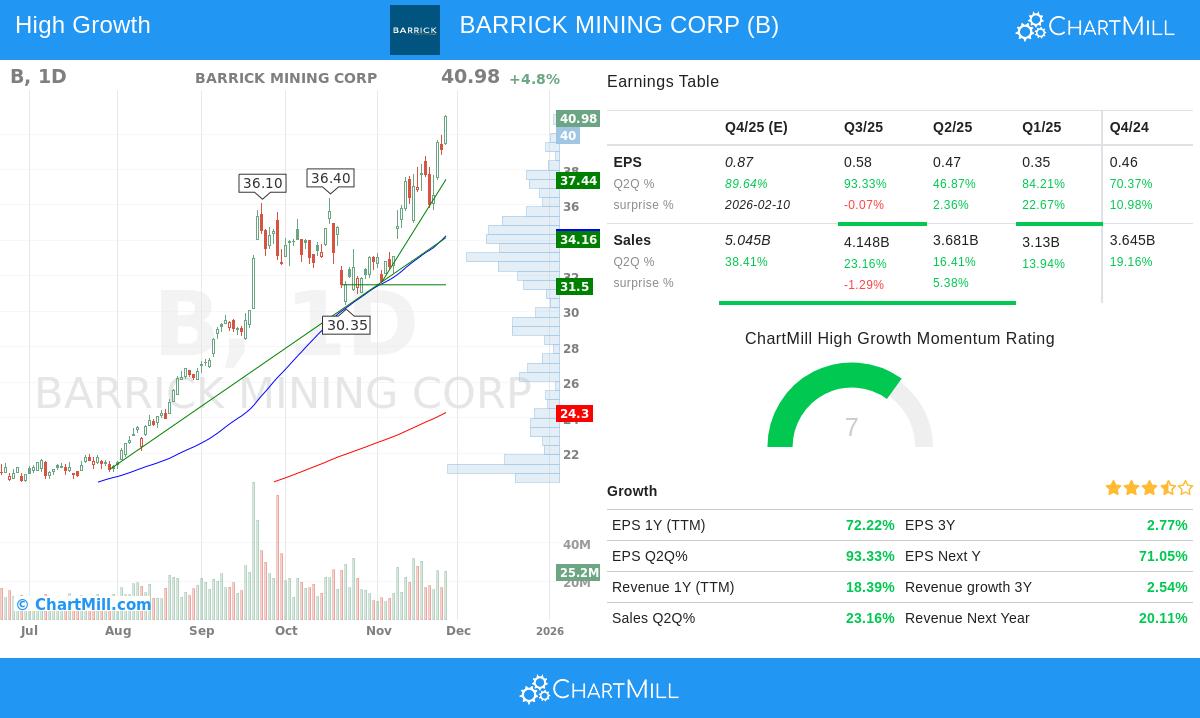
While the Trend Template finds the "when" to buy, the High Growth Momentum score helps verify the "why." Barrick's HGM score indicates a company going through a strong fundamental improvement, which frequently serves as the reason for continued price gains. The company's latest financial results display the type of fast growth that draws large investors.
The fundamental information shows a company in a solid growth period:
- Earnings Per Share (EPS) Jump: EPS growth over the last twelve months is a notable 72.2%. Even more positive is the latest quarterly speed, with the last quarter showing a 93.3% year-over-year rise in EPS.
- Positive Earnings Surprises: The company has exceeded EPS predictions in three of the past four quarters, with an average beat of almost 9%, showing that its results are regularly surpassing what the market anticipated.
- Increasing Analyst Belief: Analyst opinion is very favorable, with the average EPS forecast for the next year being increased by 34% over the past three months. Such large upward changes are a strong sign of increasing belief in the company's future.
- Growing Profitability: The company's profit margin in the last reported quarter was 31.4%, a large gain from 15.1% two quarters before, showing not just revenue growth but also better operational performance and pricing strength.
Technical Condition and Setup Evaluation
The provided technical report gives Barrick a top score of 10 out of 10, putting it in the best group of stocks from a technical condition viewpoint. The report states that both short-term and long-term trends are good, and the stock is presently reaching new 52-week peaks. However, it also gives a word of warning for new purchases. The Setup Quality score is poor, at 2, meaning the stock could be overstretched in the short term after its good rise. The report conclusion proposes that while the technical base is very good, investors could gain from waiting for a time of consolidation or a decline to an important support area, like the range between $35.75 and $36.54, to locate a better, lower-risk purchase point.
For a detailed look at the support levels and a full study, you can see the complete Technical Analysis Report for Barrick (B).
Locating Comparable Possibilities
The pairing of Minervini's detailed trend-following rules and a concentration on high-growth fundamentals can be a strong way to create a watchlist. For investors curious about finding other stocks that presently fit this strict group of requirements, the screening process that found Barrick is a useful beginning.
You can locate more possible choices by using the High Growth Momentum + Trend Template screen on ChartMill.
Disclaimer: This is not investment advice. This analysis is for informational and educational purposes only. It is not a recommendation to buy, sell, or trade any security. All investments involve risk, and you should conduct your own research and consult with a qualified financial advisor before making any investment decisions. Please read our full disclaimer and terms of use to understand our obligations.