
Investors looking for companies with high growth potential frequently use a two-part method that mixes fundamental and technical review. This process finds stocks with good business results and positive price action. The method centers on firms with strong revenue and profit increases, good profitability measures, and stable financial conditions, all signs of lasting growth stocks. When these basic qualities match with positive technical formations, especially breakout shapes from periods of sideways movement, it can point to a chance for notable price gains.
AMAZON.COM INC (NASDAQ:AMZN) is a good example of this investment method. The e-commerce and cloud computing leader has shown great strength and expansion in spite of its large size, continuing to increase its lead in many business areas.
Fundamental Strength Review
Amazon's fundamental picture shows a company that keeps beating forecasts for a firm of its scale. The company gets a good total fundamental score of 6 out of 10, with especially high marks in growth and profitability areas. These numbers are important for growth investing, as they show the company's capacity to grow its business while using capital well.
Important fundamental points are:
- High profitability measures with an 8/10 score
- Good return on equity of 21.16%, doing better than 83% of similar companies
- Notable profit margin increase to 10.54%, in the top 14% of general retailers
- Revenue growth of 10.87% over the last year, with 17.86% average yearly growth over many years
- EPS growth of 56.94% in the past year, showing major operational efficiency
The company's growth path stays notable, especially considering its large size. Amazon Web Services keeps leading the cloud computing field, while its e-commerce business holds onto solid progress. The fundamental review report accessible via ChartMill's detailed review gives more information on these numbers.
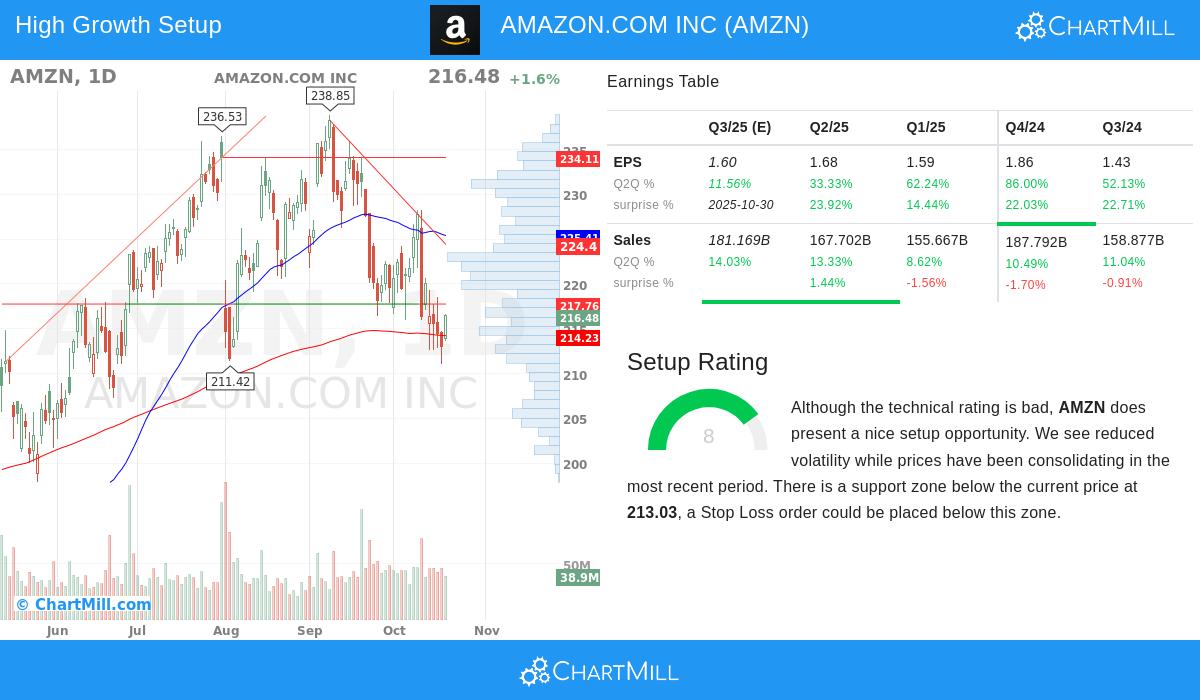
Technical Formation Review
From a technical view, Amazon shows an interesting formation even with recent market difficulties. The stock now has a technical score of 1 out of 10, which could seem worrying at first. But, the formation score of 8 out of 10 shows the stock is making a possibly good pattern for future price action.
Key technical notes are:
- Prices have been moving sideways in the $211.03 to $228.25 band lately
- Important support is found at $213.03, made by several trend lines over different periods
- Resistance levels are seen between $217.76 and $220.41, marking a main breakout point
- Lower volatility during this period hints at possible force gathering for a price move
- The stock trades in the middle of its 52-week range while the overall market reaches new peaks
This technical arrangement is especially important for growth investors because sideways periods often come before major breakouts. When fundamentally sound companies like Amazon set clear support levels and start to test resistance areas, it can indicate gathering institutional buying and chance for upward movement. The full technical review report provides complete chart study and shape identification.
Growth Path and Market Standing
Amazon's growth narrative goes beyond simple financial numbers. The company holds leading spots across several high-growth fields, including cloud computing, e-commerce, digital advertising, and streaming services. This spread gives several sources for ongoing growth, lowering dependence on any one income stream.
The company's development pipeline stays strong, with ongoing spending in artificial intelligence, logistics improvement, and healthcare projects. Amazon's ability to put profits back into new growth areas fits well with the growth investing idea, where companies focusing on expansion instead of dividend payments often give better long-term results.
Investment Points
While Amazon shows a appealing growth outline, investors should think about several items. The stock trades at high valuation multiples, with a P/E ratio of 33.00, showing market hopes for continued good performance. But, when considering growth chances through the PEG ratio, the valuation seems more acceptable given the company's excellent profitability and market position.
The present technical formation suggests waiting might be needed, as the stock moves through its sideways period. Still, for growth investors with longer time frames, these times can offer planned entry points before possible breakout moves.
For investors wanting to find similar chances, other solid growth stocks with positive technical formations can be located using this specific screening tool that joins fundamental growth standards with technical shape identification.
Disclaimer: This review is for information only and does not make up investment advice, suggestion, or backing of any security. Investors should do their own study and talk with financial advisors before making investment choices. Past results do not ensure future outcomes.