
The "High Growth Momentum + Trend Template" screen is a method built to find stocks that fit the strict rules of Mark Minervini's trading system. This process uses two key views: first, the Minervini Trend Template, which selects for stocks showing clear, confirmed uptrends across different periods. Second, the High Growth Momentum (HGM) rating, which measures a company's fundamental growth path, looking at faster earnings, sales, and good analyst changes. The aim is to locate investments where outstanding technical condition is supported by solid and getting better business results, a pairing that has often been a sign of top market performers.
Advanced Micro Devices (NASDAQ:AMD) appears as a candidate from this screening process, offering a case study in how a top semiconductor company can fit the ideas of growth and momentum investing.
Checking the Trend Template Fit
Mark Minervini's Trend Template is a basic technical list made to confirm a stock is in a definite, strong uptrend, what he calls a Stage 2 advance. It removes personal judgment by applying fixed rules on moving averages, price location, and relative strength. For AMD, a check of the given data shows a good fit with these rules:
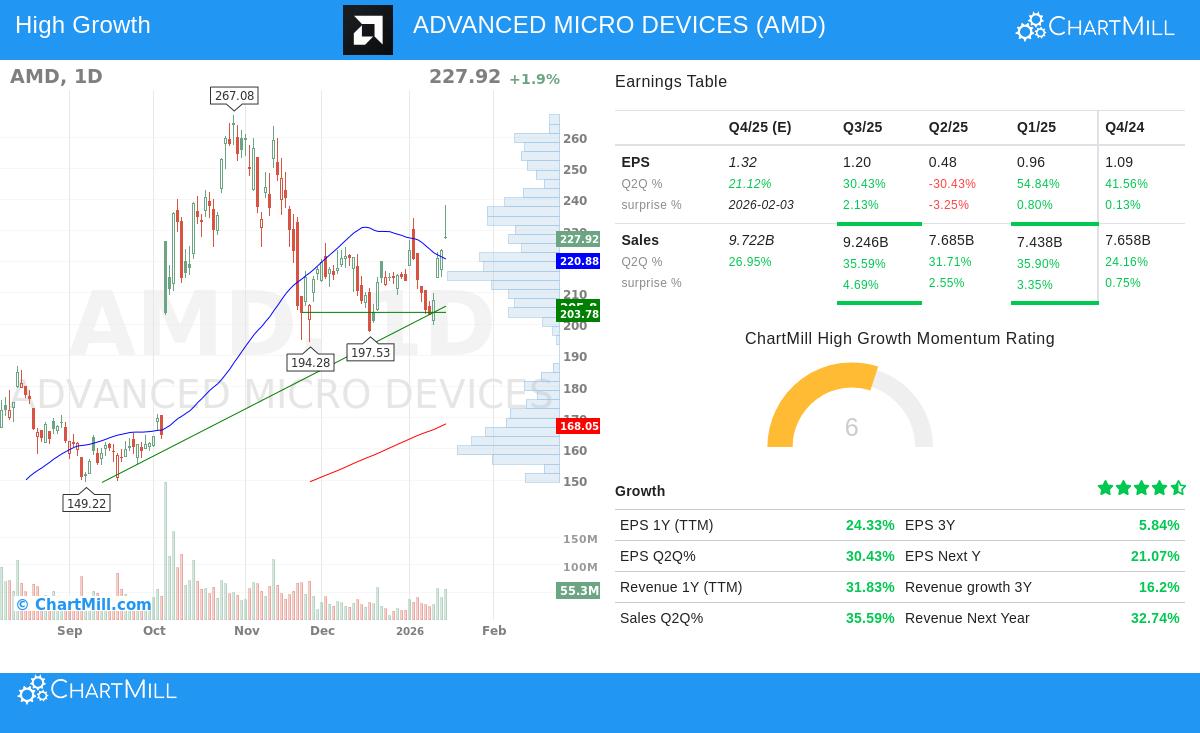
- Moving Average Fit: The stock's price ($227.92) trades above its important moving averages (50-day: $220.88, 150-day: $189.62, 200-day: $168.05). Importantly, the 150-day and 200-day averages are both going up, confirming the long-term uptrend. The 50-day average, while now above the longer-term averages, shows a small recent decrease, a point for careful watching but not a clear failure of the template's main alignment rule.
- Nearness to Highs: A principle of the Minervini method is to focus on strength, not low price. AMD's current price is within 15% of its 52-week high ($267.08) and is a large 198% above its 52-week low ($76.48). This meets the template's rules of being within 25% of the high and at least 30% above the low, showing the stock is in a leading spot, not a rebound.
- Better Relative Strength: Maybe one of the most significant measures in the Minervini system is relative strength (RS). AMD has a ChartMill Relative Strength score of 91.0, meaning it has done better than 91% of the market. This is a clear sign of institutional interest and confirms the stock is a leader, not a follower, which is needed for catching the strongest moves.
This technical picture indicates AMD is working within a sound Stage 2 uptrend. The good long-term and short-term trends mentioned in the technical report add support to this view. The strictness of the Trend Template makes investors ignore stocks in resting or falling stages and look only at those already showing top market price action, a main point to avoid poor value picks and find major trends early.
Checking High Growth Momentum Fundamentals
While the Trend Template handles the "when," the High Growth Momentum rating tries to answer the "why" by checking the fundamental driver behind the stock. Minervini's plan stresses that the largest stock market winners are nearly always backed by solid, and often speeding up, earnings and sales growth. The given data on AMD shows several supports of high-growth momentum:
- Solid Earnings Path: The company shows notable earnings growth, with EPS (TTM) up 24.3% year-over-year. More significantly, recent quarterly results show speed, with the last reported quarter showing EPS growth of 30.4% compared to the same quarter last year.
- Strong Sales Growth: Revenue growth is a key driver. AMD's TTM revenue has grown by 31.8%, and the last quarter saw a notable 35.6% year-over-year sales gain. This top-line strength gives a firm base for bottom-line growth.
- Good Analyst View and Changes: A main part of the HGM rating is upward changes, which signal increasing belief in the company's future. Analysts have increased their average guesses for AMD's next-year earnings by 1.98% and revenue by 3.06% over the past three months. This "estimate change speed" is often a forerunner to more price gains.
- Getting Better Profitability: The company's profit margin in the last reported quarter was 13.44%, showing a step-by-step gain and a large rise from 6.36% in the last full fiscal year. This shows not just growth, but higher-quality, more profitable growth, a sign of a company gaining operational efficiency and price control.
These fundamental points fit with the Minervini idea that "big earnings draw big notice." The pairing of strong absolute growth, positive estimate changes, and margin gain suggests AMD has the fundamental cause that can maintain and push its already-good technical trend.
Technical Condition and Present Situation
According to the ChartMill Technical Report, AMD gets a strong 8 out of 10 on its technical rating. The summary points out a "consistent performance in both the short and longer term time frames" and says the stock is "showing a nice and steady performance" compared to the whole market. This high rating supports the number-based findings from the Trend Template screening.
However, the report also gives important detail for timing. The setup quality rating is now a 2, with the analysis saying that while the technicals are very good, the stock "does not present a decent entry opportunity at the moment" due to unstable price movement after a strong recent climb. It proposes waiting for a resting period to allow for a more clear, lower-risk entry point. This detailed view is key; even a stock that passes all first screens needs careful chart study to find a precise, low-risk entry as required by Minervini's Specific Entry Point Analysis (SEPA).
You can review the full, detailed technical analysis for AMD here.
A Candidate for the Growth-Momentum Watchlist
In summary, Advanced Micro Devices shows a profile that matches the central ideas of the combined High Growth Momentum and Trend Template plan. It displays the technical signs of a market leader in a clear uptrend, backed by fundamental measures that show speeding revenue, solid earnings growth, and good analyst view. While the present chart suggests waiting for a best entry point after its recent instability, AMD represents the kind of investment that growth and momentum investors look for: one where strong business performance is being seen and valued by the market.
For investors looking for more possible candidates that meet this mix of good technical trends and high-growth fundamentals, the screening process that found AMD can be repeated and looked into further. You can access the "High Growth Momentum + Trend Template" screen directly on ChartMill to see present results and do your own study.
Disclaimer: This article is for informational and educational purposes only. It is not a recommendation to buy or sell any security. The analysis is based on provided data and a specific screening method. All investing and trading involves risk, including the potential loss of principal. Always conduct your own complete research and consider your financial situation and risk tolerance before making any investment decisions.