
Technical analysis investors often look for stocks showing both good momentum and attractive entry levels. One methodical approach uses a filter for securities with high technical ratings, pointing to good price trends, paired with high setup quality scores, which imply the stock is in a period of consolidation and might be ready for a new upward move. This method aims to find market leaders that are pausing, possibly giving a chance to join an existing upward trend with less risk. Alnylam Pharmaceuticals Inc (NASDAQ:ALNY) recently appeared from this kind of filter, presenting an interesting case for more examination by investors focused on technicals.
Technical Strength and Trend Analysis
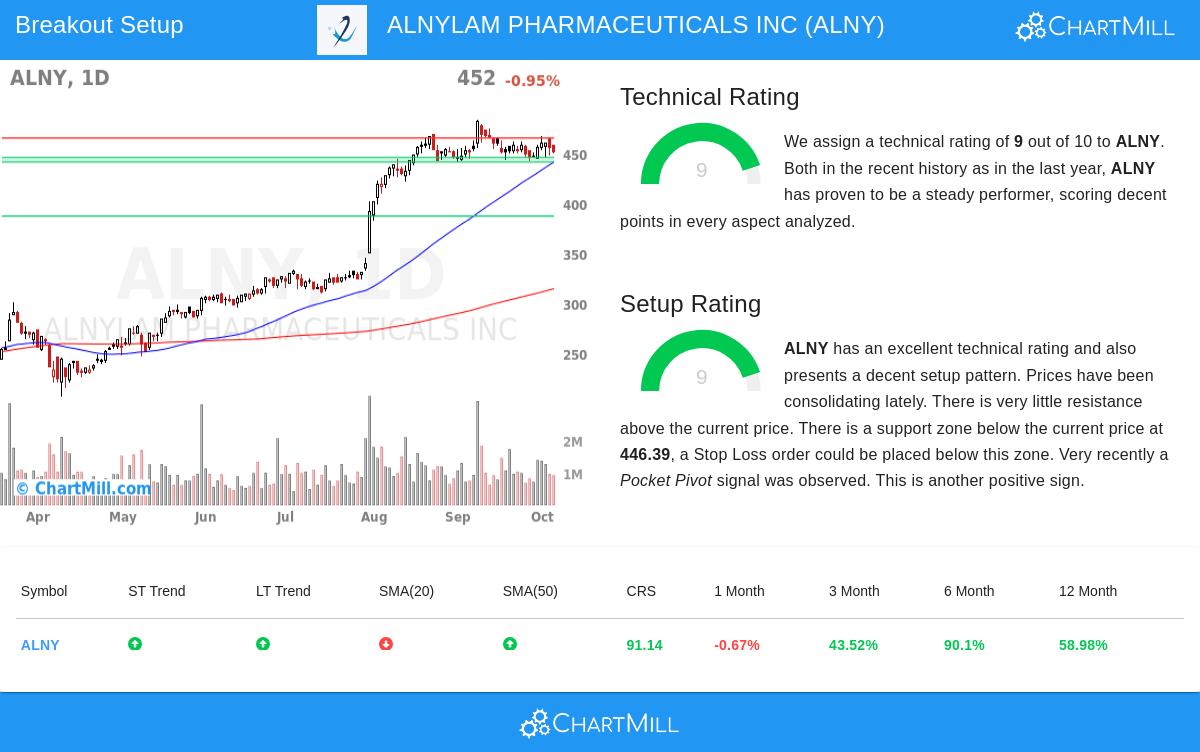
A basic part of this breakout method is a stock's fundamental technical condition, which is measured by the ChartMill Technical Rating. A high rating means a stock is in a good and steady uptrend over several time periods. Alnylam shows very good technical strength, getting a top-level rating of 9 out of 10. This score is backed by a combination of good factors listed in its technical report.
- Consistent Positive Trends: Both the long-term and short-term trends for ALNY are rated as positive, showing continued buying interest.
- Better Relative Performance: When compared to the whole market, ALNY is doing better than 91% of all stocks. Inside its busy biotechnology sector, it does better than 81% of its 536 competitors.
- Good Moving Average Position: The stock is priced above its important moving averages (50-day, 100-day, and 200-day), and all of these averages are in upward patterns. This arrangement of averages is a typical indicator of a sound uptrend.
This solid technical foundation is important for the method because it raises the chance that any breakout from a period of consolidation will continue the main upward direction instead of failing.
Setup Quality and Consolidation Pattern
While a good trend is necessary, getting into a stock at a good level is also very important. The ChartMill Setup Quality Rating evaluates the quality of a stock's present chart formation, specifically searching for tight consolidation that gives a distinct zone of support. ALNY does very well here too, having a setup rating of 9. This high score shows the stock is making a constructive formation that might come before a notable price change.
The technical report points out several important features that add to this very good setup rating:
- Consolidation Phase: The report states that prices have been consolidating lately, moving in a band between about $442 and $484 over the last month. This break in the trend lets the stock reduce any overbought state.
- Clear Support and Resistance: An important support area has been found between $441.68 and $446.39, made from a mix of moving averages and trendlines. This gives a distinct level for handling risk. For resistance, an important level is noted at $465.90.
- Pocket Pivot Signal: A recent "Pocket Pivot" signal was seen, which is a price and volume formation often showing buying by big investors. This acts as a positive sign inside the consolidation.
For traders, this high-quality setup means a possible trading plan. The analysis proposes an entry point just above the $465.90 resistance level, with a stop-loss order set below the support area near $442.50. This framework gives a clear risk-to-reward situation.
Market Context and Risk Considerations
The present positive trends in the wider S&P 500 give a good environment for breakout methods. Still, it is always important to think about stock-specific factors. While ALNY's technical and setup scores are interesting, the report does note that the stock's recent trading band has been fairly wide, and it is now trading near the bottom part of that band. Investors should also remember that Alnylam is a biopharmaceutical company, and its stock can be sensitive to price swings linked to clinical trial outcomes, regulatory news, and product updates. Always check recent news and official documents before making any investment choice.
This examination of Alnylam Pharmaceuticals shows the practical use of mixing technical and setup ratings to find possible opportunities. For investors wanting to find other stocks now showing similar breakout traits, a new list of options is made every day and can be found using the Technical Breakout Setups screen.
Disclaimer: This article is for informational purposes only and does not constitute investment advice of any kind. The provided analysis and any mentioned trade setups are automatically generated and should not be interpreted as a recommendation to buy or sell any security. All investments involve risk, and you should conduct your own research and consult with a qualified financial advisor before making any investment decisions.