Relative Strength Performance Filter
By Aldwin Keppens - reviewed by Kristoff De Turck
Last update: Mar 20, 2024
At ChartMill we assign a Relative Strength rating number to every stock in our database. The relative strength number of a stock (=CRS) indicates how well the stock has been performing over the last year compared to all other stocks in our database. The maximum number is 100, the minimum number is 0. When a stock has relative strength number 100, it means that it outperformed all other stocks in the database. When the value would be 90, it means that this stock outperformed 90% of all other stocks.
We calculate this number by looking at the performance of each stock over the last year, but we put more weight on the most recent performance by adding the performance of the last quarter. After calculating the absolute performance for each stock, we will rank all stocks according to the above metric. After ranking them, we can assign a value between 0 and 100 for each stock. The stock with the highest value for the metric will get value 100 because it outperforms all other stocks ( = 100% ) in our database. The second one only outperforms 7999 of 8000 stocks, so it will get a Relative Strength number of 99.99.
So in short: the relative strength rating number is a number obtained by ranking all stocks of a market by performance.
The ChartMill relative strength number database has several 'segments' as we do not compare the stocks across regions. There are seperate relative strength rankings for the US segment, Canada and Europe.
IMPORTANT! Please note that relative strength as described in this article has nothing to do with the RSI indicator. The latter is a purely technical indicator that looks at how strong the price movement is in an inidividual stock. More detailed information can be found in this article.
Relative Strength Rating on the stock charts
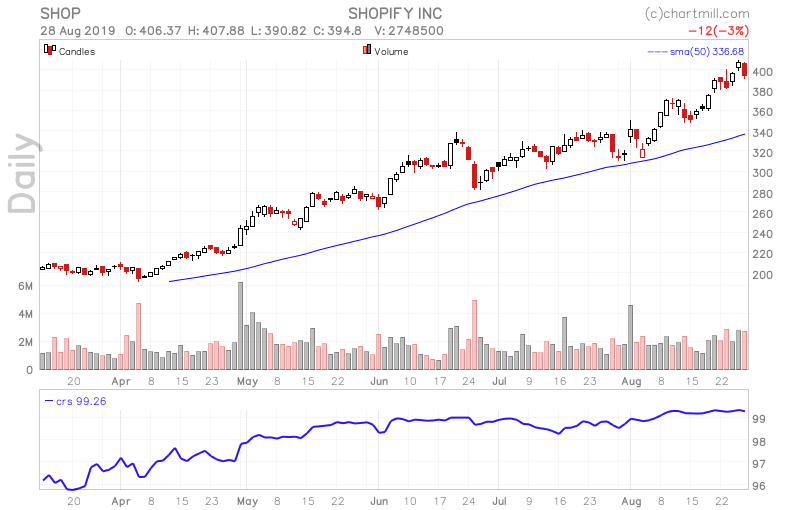
In the stock charts you can add the ChartMill Relative Strength to you chart as an indicator. The indicator will display the historical relative strength of the stock, as shown in the example below:
Relative Strength Stock Screener
People trading high growth stocks, like for instance CANSLIM traders often find high relative strength important. If you look at the SHOP chart above, it roughly doubled in less than 6 month time. Would have been a great pick! But you can see that the Relative Strength Indicator had already a value above 96 in the beginning of the displayed period. So it was already amonst the best stocks on the market before the start of the chart. It is not unusual that leading stocks can keep on rising ( or keep a high relative strength) for a long period of time. And this is why our stock screener is equiped with many relative strength tools.
Relative Strength filtering
The filters related to Relative Strength can be found on the performance tab of the stock screener.
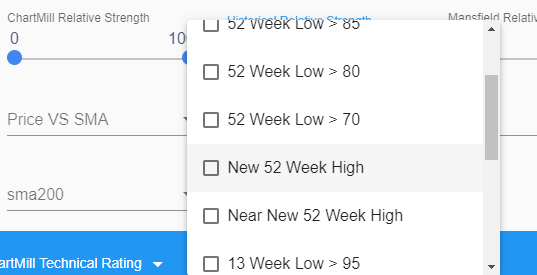
The following filters are available:
- A slider that allows you to filter on the minimum and maximum ChartMill Relative Strength value.
- Filters related to the 13 or 52 week high or low of the CRS number. This allows you to look for stocks with an improving relative strength.
Relative Strength Sorting
The stock screener also allows to sort by Relative Strength for each filter or combination of filters you select. This allows for instance to rank the output of any screen according to Relative Strength. You can find the criteria under 'performance' in the sorting options.
The relative strength number is also displayed in the tables, the technical views or your custom views.
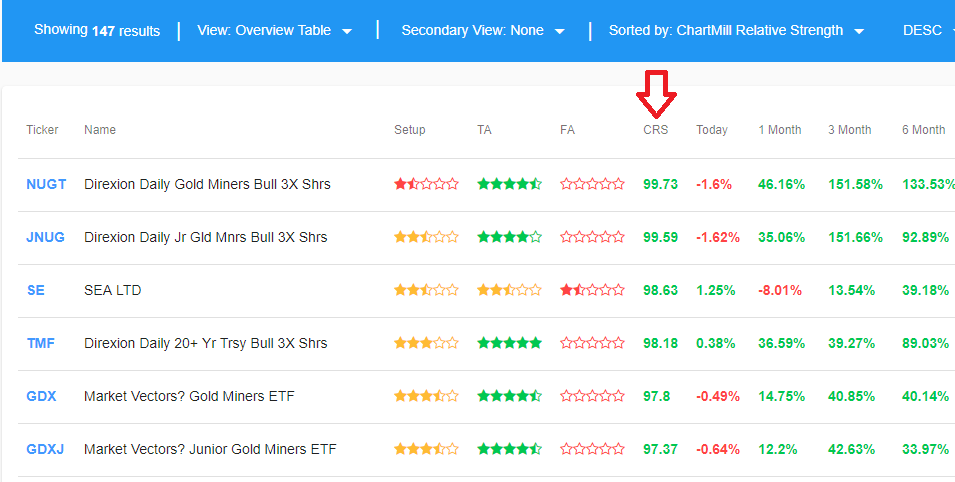
A possible use case would be to sort ETFs according to relative strength to see which sectors or areas are doing well in the current environment. In the screenshot below you can see that at the time of writing it looks like gold related things were hot:
Other Relative Strength Filters Available in ChartMill
Dorsey Relative Strength
This form or Relative Strength was described and used in the book “Point & Figure Charting” by Thomas Dorsey. Read more...
Mansfield Relative Strength
This variant of Relative Strength was used in the book “Secrets For Profiting in Bull and Bear Markets’ by Stan Weinstein. Weinstein was using the indicator mainly on weekly charts. Read more...