Understanding the Stochastic Oscillator
By Kristoff De Turck - reviewed by Aldwin Keppens
Last update: Apr 26, 2023
Introduction
The stochastic oscillator dates back to the late 1950s and was developed by George Lane who was part of a group of futures traders. His buying and selling decisions were mainly based on technical analysis. It is one of the many available technical indicators and it belongs to the family of oscillators. These are indicators that move between an upper and lower boundary to identify short-term overbought or oversold conditions.
In the case of the stochastic, there are two lines of interest, the %K line and the %D line where;
%K = (current closing price - lowest price in the period used)/(highest price in the period used - lowest price in the period used)*100
%D = 3-day simple moving average of %K
The default value for the 'period used' in %K is '14'.
The default value for the %D is '3'
The default period itself is not tied to a specific timeframe, so the number 14 can represent weeks, days, hours or even minutes. In this way, the %K and %D form two lines with the %D acting as the trigger line.
In ChartMill, both the Fast, Slow and Full Stochastic are available.
The Stochastic follows the speed (momentum) of the price. Lane himself assumed that momentum changes earlier than price. Bullish and bearish divergences between the price and the oscillator are important indications of possible reversals. The vast majority of online articles available on this indicator however focus on the overbought and oversold conditions and subsequent signals generated by this indicator in sideways trading ranges.
Example 1: Price in a sideways trading range
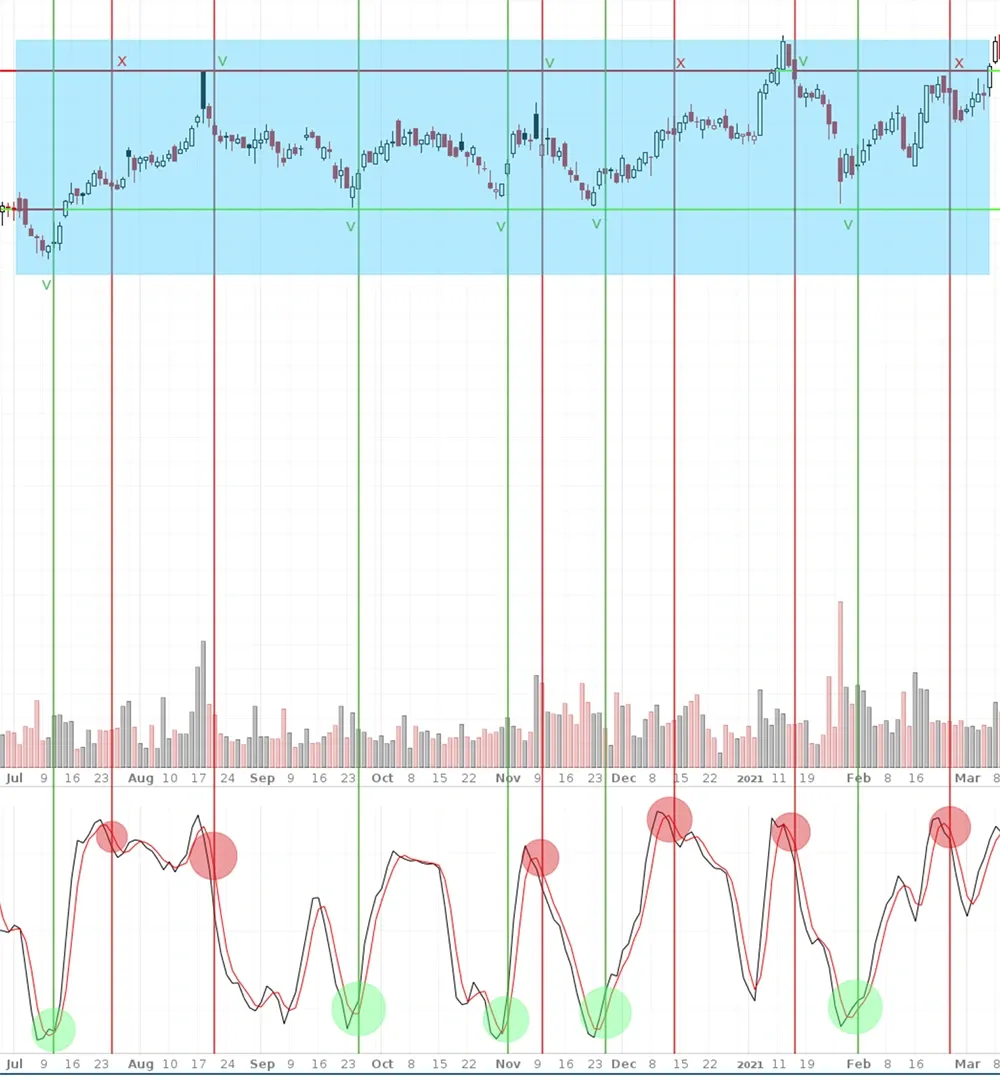
The chart above shows a stock moving sideways and thus consolidating. The indicator under the price chart is the Stochastic oscillator with the default settings (%K 14 and %D 3). Only crossings of the %D with the %K occurring above the 80 (overbought) or below the 20 level (oversold) were considered as buy or sell signals. In total there were 11 trigger signals, 5 buy signals (green circles) and 6 sell signals (red circles).
A buy signal is considered successful if the market price reached the horizontal red line before the stoploss placed below the green horizontal line. A sell signal is considered successful if the market price reached the horizontal green line before the stoploss placed above the red horizontal line. One exception here for the second last sell signal where the stoploss was above the prevailing highest price at the time.
Of the 11 signals no less than 8 were successful! Wonderful right? Absolutely, but unfortunately the price does not always allow itself to be guided in such a well-defined price zone. The picture suddenly becomes completely different if we look at a stock whose price is in a clear upward trend.
Example 2: A sharply rising price trend
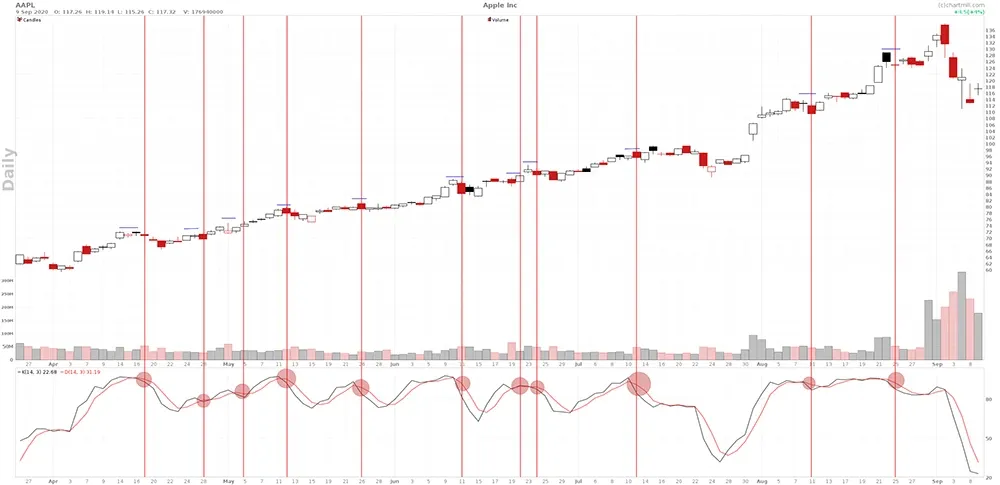
The above chart of Apple is a clear proof that those who just blindly take positions based on the overbought Stochastic signals will usually be disappointed. Overbought levels can remain 'overbought' for a long time as long as the stock is moving in a clear strong upward trend. In fact, in the chart above, the trend is so strong that the Stochastic indicator rarely drops below the 60 level and only once below the 50 level!
Of course, the same is true for stocks that are falling sharply and where buying would be done based on the low Stochastic values.
Nevertheless, the Stochastic can certainly be used in markets that show a strong trend. In a bullish market you only take into account the Stochastic buy signals, for bearish markets only the sell signals. Below the chart of the ticker ACM as an example.
Example 3: A rising price trend with intermediate retracements
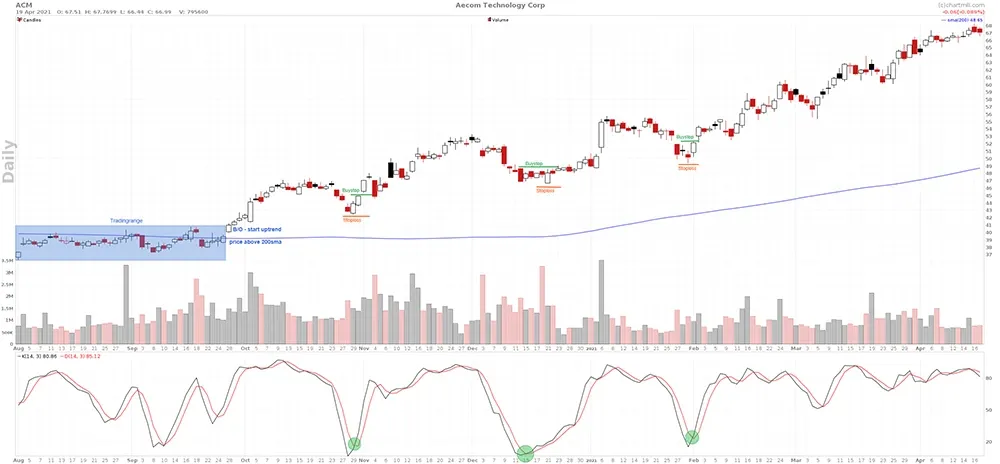
In contrast to Apple's price chart, in Aecom Technology's chart we see that the price occasionally drops slightly. This gives potential buyers the opportunity to step in and benefit from the existing bullish trend. In terms of timing, the stochastic oscillator is a very suitable indicator under these circumstances.
The green circles in the chart indicate the moments when the Stochastic indicator falls below the 20-level and a trigger signal is generated (upward crossing of the %D-line with the %K-line). Since the trend of the stock is bullish (after a bullish breakout from a trading range and price quotes above the 200SMA) only the buy signals are retained. The long position could be extended twice more after the initial purchase in order to benefit even more from the upward price trend.
In addition to these overbought and oversold levels, the so-called "divergence signals" between the price and the stochastic indicator are also worth keeping an eye on. More on that subject in a forthcoming article.
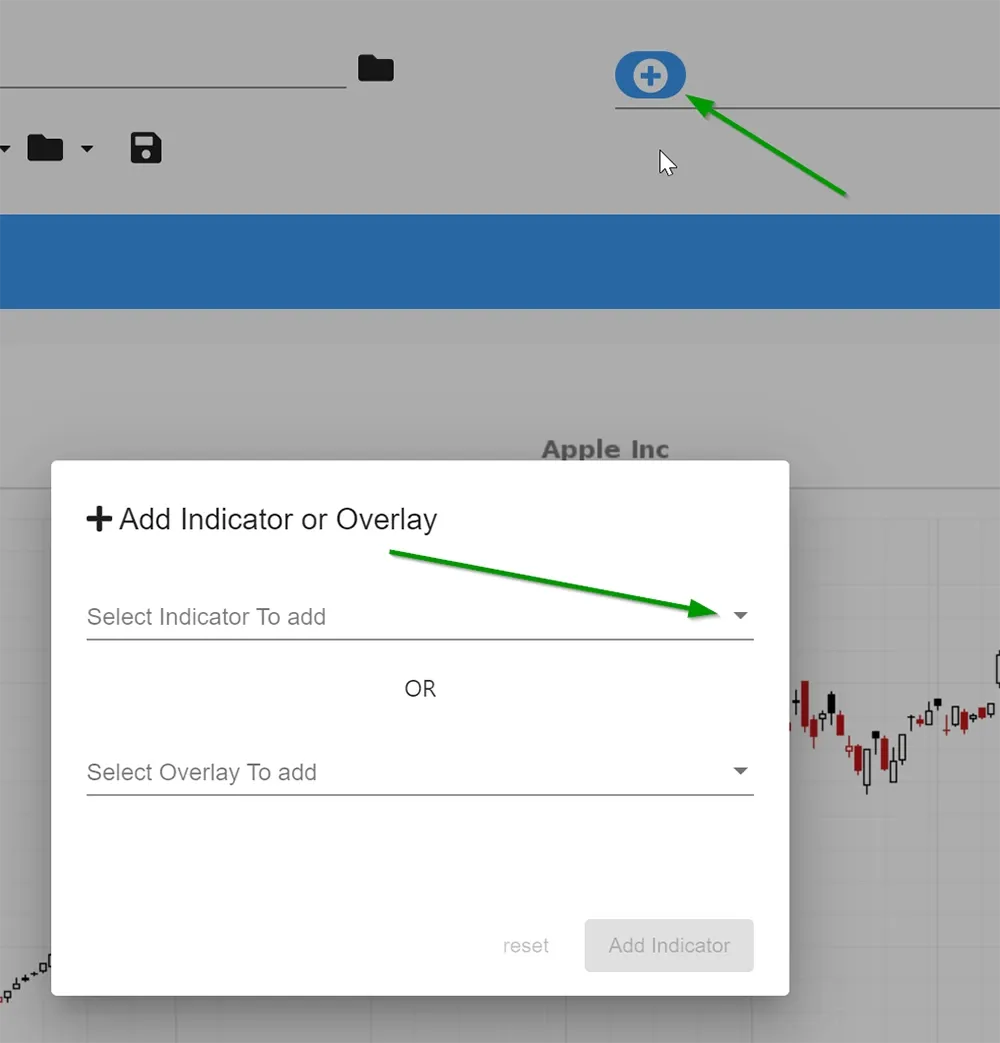
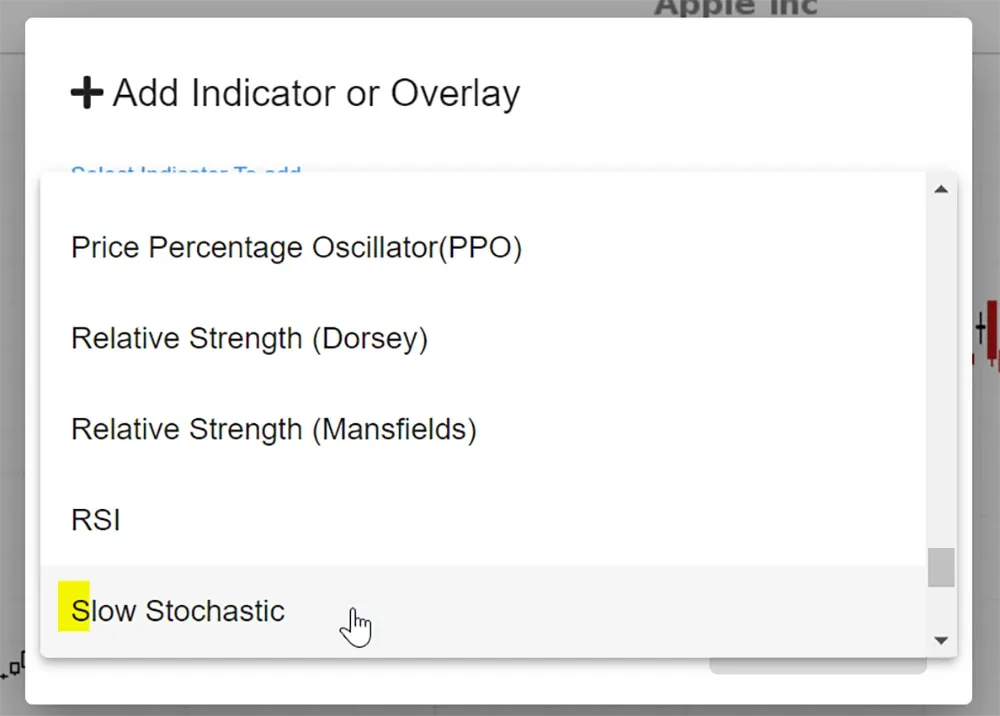
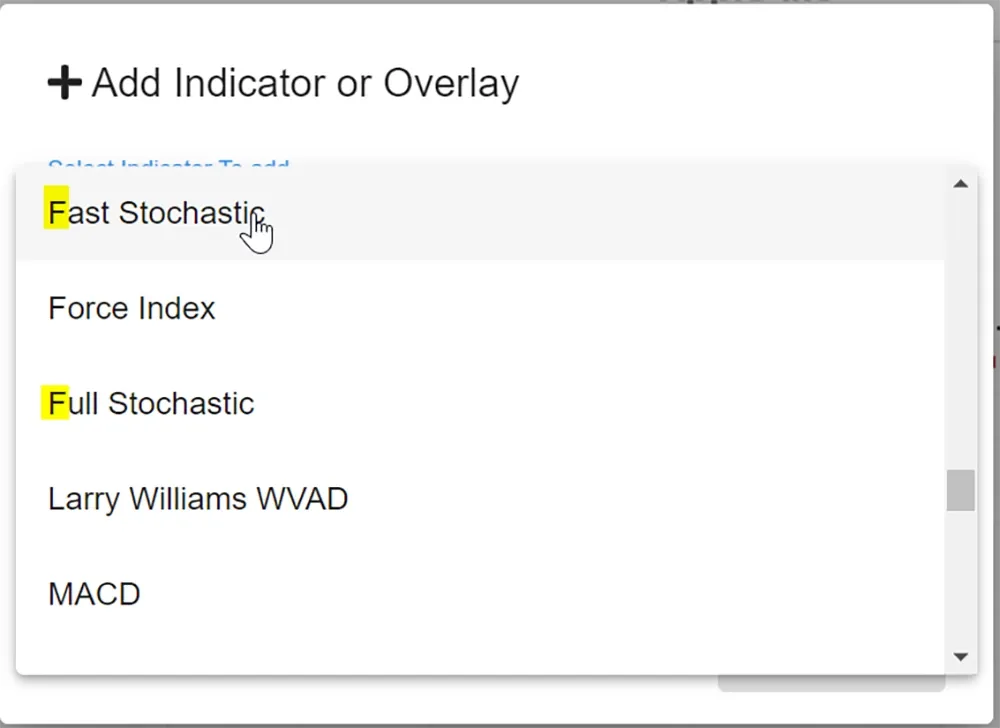
Adding the stochastic as an indicator on the chart is done by clicking on the + sign and then selecting indicator. Both the slow, fast and full stochastics are possible. The indicators are arranged alphabetically. If you type the first letter in the indicator field, you immediately get an overview of all indicators with a name starting with this letter.