
Investors looking to find high-potential stocks in strong uptrends often use systematic frameworks that mix technical and fundamental analysis. One well-known method is the Mark Minervini strategy, which uses a specific Trend Template to filter for technically sound stocks showing clear upward momentum. This method is often paired with screens for high growth momentum (HGM), concentrating on companies with accelerating earnings and sales. The aim is to locate securities where strong price trends are backed by fundamental improvement, forming a combination of elements that may come before major price gains.
ZYMEWORKS INC (NASDAQ:ZYME) recently appeared from a screen made to find these opportunities, filtering for stocks that fit Minervini's strict Trend Template while also having a high growth momentum rating. This pairing indicates the biopharmaceutical company may deserve more attention from growth-focused investors.
Fitting the Minervini Trend Template
Mark Minervini's Trend Template is a group of fixed technical rules made to confirm a stock is in a clear, strong uptrend. It works as a quality filter, avoiding investment in weak or consolidating stocks. A check of ZYME's chart and key metrics shows it currently meets the main points of this template:
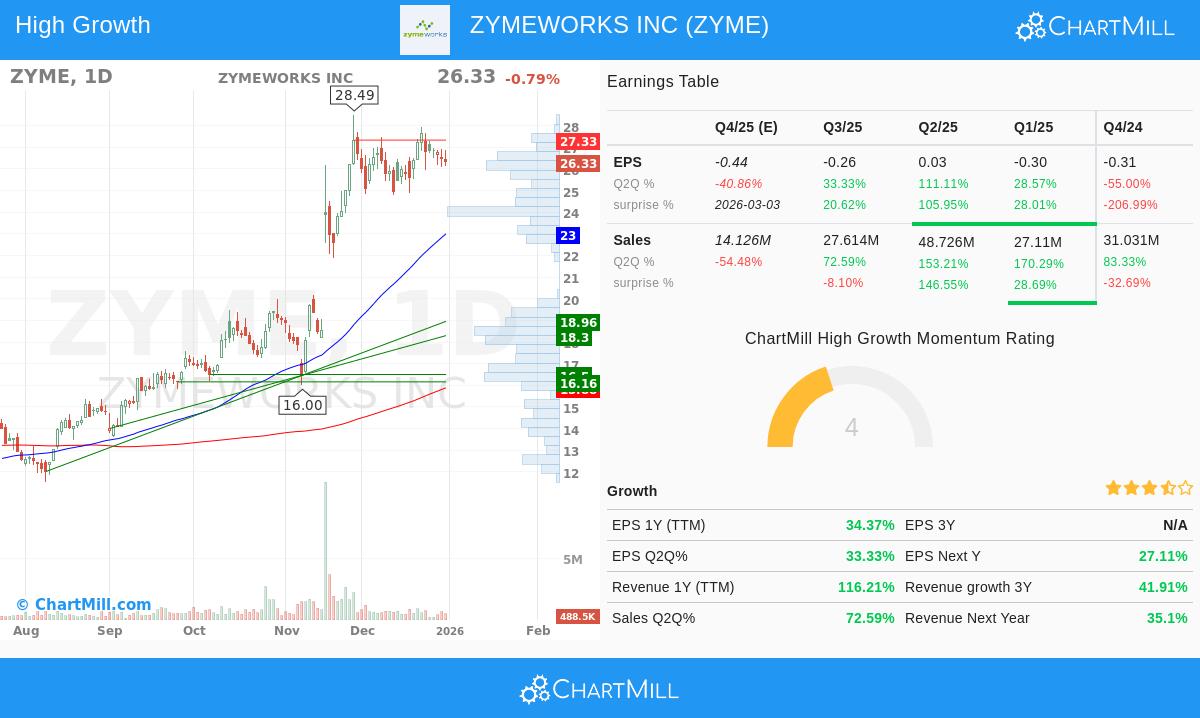
- Price Above Key Moving Averages: The stock's last price of $26.33 trades well above its rising 50-day ($23.00), 150-day ($17.23), and 200-day ($15.88) simple moving averages. This order confirms the stock is in a steady bullish phase across several timeframes.
- Moving Average Order: The 50-day moving average is above both the 150-day and 200-day averages, and the 150-day is above the 200-day. This positive sequence, with shorter-term averages above longer-term ones, shows consistent buying pressure and a strengthening trend.
- Nearness to Highs: A main Minervini rule is to focus on strength. ZYME's current price is within 25% of its 52-week high of $28.49, showing it is acting like a market leader. At the same time, the price is more than 30% above its 52-week low of $9.03, confirming a major recovery trend is already established.
- Superior Relative Strength: Perhaps most importantly, ZYME has a ChartMill Relative Strength (CRS) score of 95.73. This means its price performance over the past year beats about 96% of all stocks. Minervini notes that real market leaders show high relative strength, often moving up before the wider market.
Fitting High Growth Momentum
While the Trend Template covers the "when" to buy, the "what" to buy is often decided by fundamental momentum. The High Growth Momentum (HGM) rating looks for companies with speeding business performance. ZYME's recent financial metrics show several strong growth points:
- Rapid Revenue Path: The company's trailing twelve-month (TTM) revenue growth is at a notable 116.2%. More significantly, recent quarterly growth rates show clear speeding up, with sales growing 170.3% and 153.2% in the two quarters before the last reported period. This pattern of large sequential increase is a sign of high-momentum companies.
- Earnings Uptrend: Although the company is not yet regularly profitable on a net basis, the direction in earnings per share (EPS) is clearly getting better. The EPS growth for the last reported quarter was 33.3%, a clear recovery from a drop of 55.0% three quarters before. This positive change can be a significant catalyst, as Minervini's method often centers on shifts in profitability.
- Analyst Predictions and Surprises: The company has exceeded revenue estimates in two of the last four quarters by an average of 33.6%, showing it is regularly beating market expectations, a main driver of positive sentiment. While forward estimates have seen some lower adjustment lately, the large growth already achieved forms a solid base story.
Technical Condition and Pattern
Beyond the basic rules of the Trend Template, a complete technical analysis supports the bullish view. According to ChartMill's own assessment, ZYME receives a top Technical Rating of 10 out of 10, reflecting very good condition across short and long-term trends. The stock also gets a solid Setup Rating of 8, showing it is moving out of a time of consolidation with lower volatility, which can provide a clearer risk/reward entry point.
The analysis finds a clear resistance area between $27.23 and $27.62. A clear move above this level could mark the next part of the uptrend. On the other side, support is layered below, with the closest level near $24.94. This setup allows for a careful trading method with clear levels for entry and stop-loss placement.
For a full look at the support, resistance, and trade setup, you can see the full technical analysis report for ZYME.
Conclusion
ZYMEWORKS INC presents a strong example of a stock that fits a careful growth and momentum strategy. It meets the strict technical filters of the Minervini Trend Template, confirming it is in a strong, leadership-stage uptrend with better relative strength. Fundamentally, it shows the kind of rapid, speeding revenue growth that high-momentum investors look for, along with a better earnings trend.
The pairing of a perfect technical rating and a high setup score indicates the stock is not only in good condition but may also be nearing a possible turning point. As with any method, this analysis works as a beginning for more research, not a final suggestion. Investors should think about the company's pipeline, competitive field, and the natural volatility of the biotechnology sector.
Looking to find more stocks that fit this High Growth Momentum and Trend Template profile? You can run the screen yourself using this link: High Growth Momentum + Trend Template Screen.
,
Disclaimer: This article is for informational and educational purposes only. It is not intended as investment advice, nor does it constitute a recommendation to buy, sell, or hold any security. The analysis is based on data provided and specific screening methodologies; past performance is not indicative of future results. Always conduct your own research and consider consulting with a qualified financial advisor before making any investment decisions. Please read our full disclaimer here.