
For investors looking for a disciplined, long-term way to build wealth, few strategies are as respected as Peter Lynch’s method. The famous manager of the Fidelity Magellan Fund supported a "growth at a reasonable price" (GARP) idea, concentrating on companies with solid, lasting growth, very good financial condition, and prices that do not assume flawless results. His system, explained in One Up on Wall Street, stresses fundamental study over guessing market movements, looking for businesses that are easy to understand, make money, and are available at a logical price compared to their growth path. A filter using Lynch’s main ideas lately pointed to Yelp Inc (NYSE:YELP) as a possible choice that deserves more examination.
Fitting the Lynch Standards
A Peter Lynch filter usually looks for companies with a particular mix of growth, value, and financial soundness. Yelp seems to match well with a number of these important measures:
- Lasting Earnings Growth: Lynch liked companies increasing earnings per share (EPS) between 15% and 30% each year, as growth beyond these limits was frequently seen as hard to maintain. Yelp’s five-year average EPS growth of about 25% falls inside this preferred range, pointing to a strong and consistent rise in profits.
- Good Value Using PEG Ratio: Maybe the central part of Lynch’s price assessment is the Price/Earnings to Growth (PEG) ratio. A PEG of 1 or less implies a stock could be fairly priced next to its growth speed. Yelp’s PEG ratio, calculated from its last five-year growth, is noted at about 0.52. This shows the market is pricing the company’s earnings at a large reduction to its past growth, an important sign for value-focused growth investors.
- Outstanding Financial Condition: Lynch required solid balance sheets to survive economic slowdowns. Yelp does very well here, presenting a very secure financial state.
- Operation Without Debt: With a Debt/Equity ratio of 0.0, Yelp has no debt that charges interest. Lynch clearly favored companies with little or no debt, as it lowers danger and allows more financial options.
- Good Liquidity: The company’s Current Ratio of 2.99 is much higher than Lynch’s lowest limit of 1, showing more than enough short-term assets to meet responsibilities.
- High Profit Generation: A minimum Return on Equity (ROE) of 15% was a Lynch requirement to make sure owner money was being used effectively. Yelp’s ROE of 20.46% not only reaches but greatly passes this level, putting it with the best in its field and indicating skilled management performance.
A Summary Fundamental View
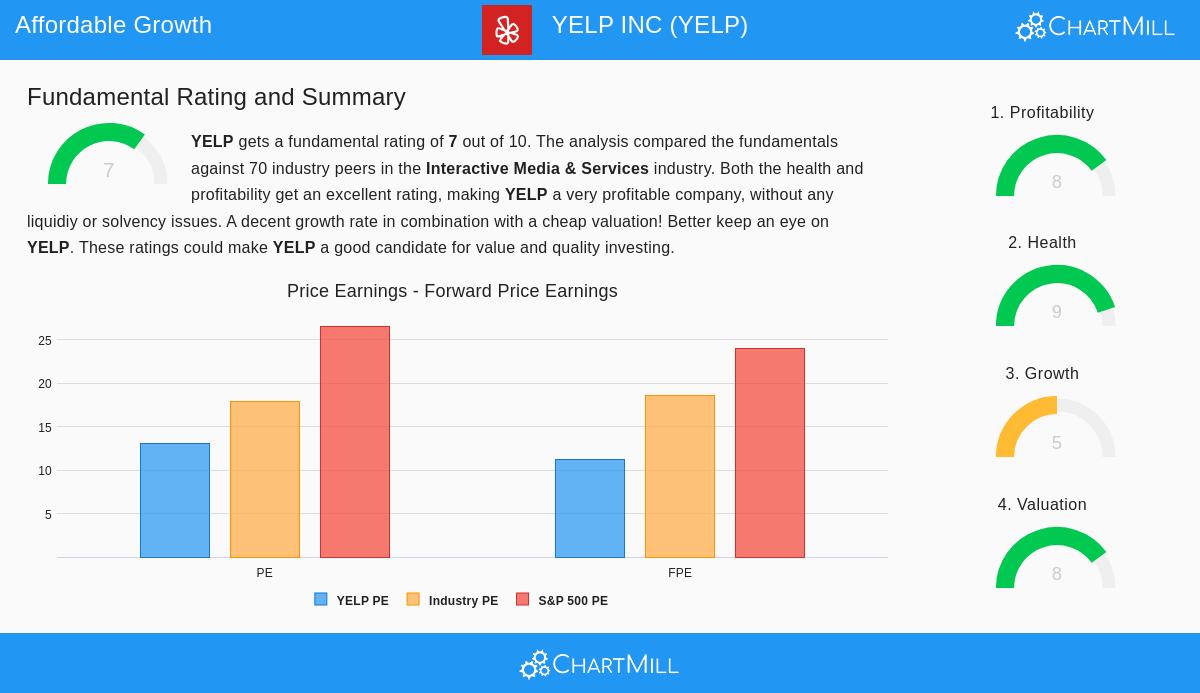
A look at Yelp’s detailed fundamental report supports the image shown by the Lynch filter. The company gets a total fundamental score of 7 out of 10, with special force in two key sections.
Its Profitability score of 8/10 comes from very good returns on assets, equity, and invested money, all placed in the top 15% of its Interactive Media & Services field competitors. Also, its profit and operating margins have displayed good change in recent years. Just as notable is its Financial Condition score of 9/10. The lack of debt, a good Altman-Z score meaning low failure risk, and steady share repurchases over the past five years describe a cautiously run company with a policy of capital use friendly to owners.
Regarding Price assessment (score 8/10), Yelp seems low-cost compared to both the general market and its industry. Its P/E and forward P/E ratios are clearly below the S&P 500 average, and using measures like Enterprise Value/EBITDA and Price/Free Cash Flow, it is priced lower than most of its direct rivals. The Growth score (5/10) is more average, showing a slower predicted sales growth in the next few years, although future EPS growth estimates stay strong.
Why These Standards Are Important for the Long-Term Investor
The Lynch method’s strength is in its complete view. The growth filter finds companies with forward motion. The PEG ratio makes sure an investor does not pay too much for that growth. The strict condition and profit checks work as a system to control risk, looking for companies that are more probable to last and increase money over ten years or longer, not only do well in a rising market. Yelp’s outline, marked by solid past profit growth, a clean balance sheet, high returns on capital, and a seemingly low price, represents this even, long-term "GARP" way. It shows the kind of business Lynch might call a possible "steady performer," a company able to give reliable returns with less comparative danger.
For investors wanting to look at other companies that pass similar strict filters, the Peter Lynch strategy filter is ready for more study. You can find more possible choices from this filter here.
,
Disclaimer: This article is for information only and is not financial advice, a suggestion, or an offer to buy or sell any security. The study is based on data and a particular investment strategy structure, it is not a replacement for personal, professional investment guidance. Investors should do their own complete research and think about their personal money situation before making any investment choices.