
The investment philosophy of famous fund manager Peter Lynch focuses on finding well-run, expanding companies available at sensible prices. His method, often called Growth at a Reasonable Price (GARP), highlights lasting business models, good financial condition, and prices that do not overestimate future potential. A central idea is the Price/Earnings to Growth (PEG) ratio, which tries to locate stocks where the price-to-earnings (P/E) ratio is supported by, or less than, the company's earnings expansion rate. By searching for companies with set standards on profit, debt, and expansion, investors can create a list of prospects deserving more study for a lasting portfolio.
One company that recently appeared from this type of Peter Lynch-based search is X Financial-ADR (NYSE:XYF), an online personal finance platform operating in China. The company, which offers loan products and wealth management services, seems to match several main Lynch ideas on a numerical basis.
Match with Lynch's Main Standards
The search uses particular filters to locate companies with a mix of expansion, sensible price, and financial soundness. X Financial's measurements indicate it justifies more examination based on these factors.
- Lasting Expansion: Lynch liked companies with solid, but not extreme, growth that could continue. The search demands a 5-year earnings per share (EPS) expansion between 15% and 30%. X Financial states a 5-year EPS expansion rate of 16.75%, fitting inside this goal range, showing a record of consistent, above-normal increase.
- Sensible Price (The PEG Ratio): This is a foundation of the Lynch method. The PEG ratio contrasts a stock's P/E ratio to its expansion rate, with a number at or under 1.0 often seen as interesting. X Financial's PEG ratio, calculated from its past 5-year expansion, is very small at 0.07. This indicates the market is pricing the company's earnings at a large reduction compared to its historical expansion path.
- Solid Profitability: Lynch sought companies that effectively produce profits from shareholder equity. The search requires a Return on Equity (ROE) above 15%. X Financial's ROE of 22.61% is much higher than this level, showing management's skill in using investor money.
- Financial Condition: To limit high risk, Lynch chose companies with careful balance sheets. The search selects for a Debt-to-Equity ratio below 0.6 and a Current Ratio above 1.0. X Financial fits both requirements, with a Debt/Equity ratio of 0.50 and a Current Ratio of 1.47, showing a controlled debt amount and enough cash to meet near-term needs.
Fundamental Condition Review
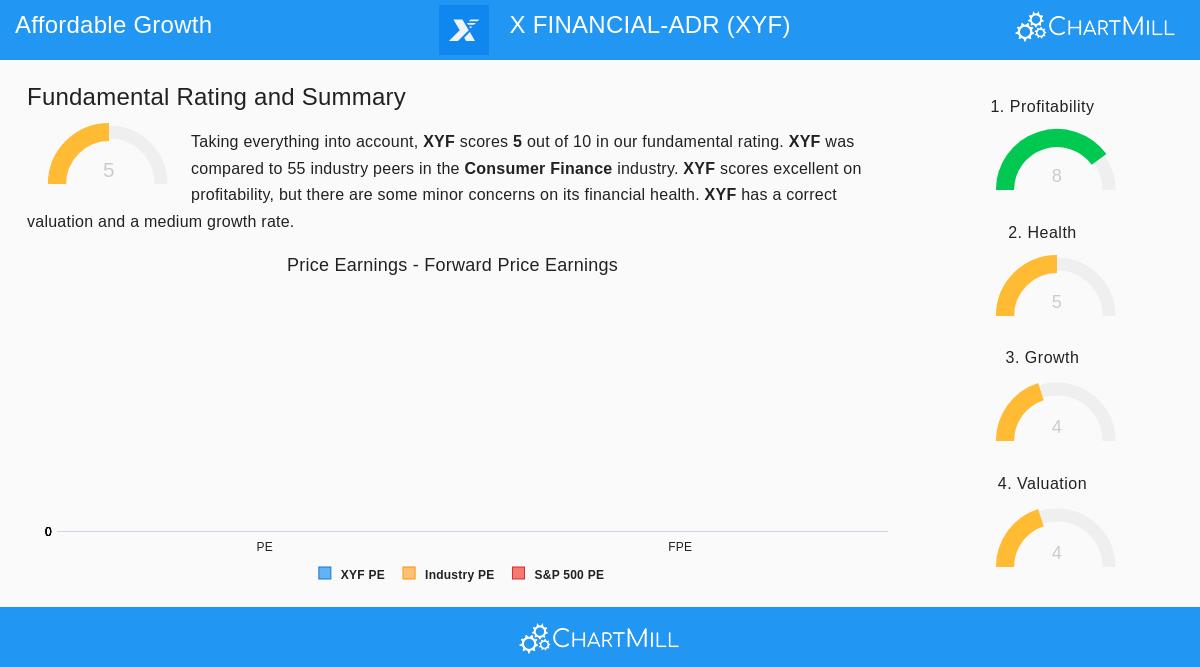
A wider look at X Financial's fundamental picture, as described in its detailed analysis report, gives background beyond the search's filters. The company gets a total fundamental score of 5 out of 10, which puts it in the middle group within the active Consumer Finance industry.
The report notes clear positives and some points to think about:
- Profitability is a clear positive, with a score of 8/10. The company has top industry margins, including an operating margin of 58.72% that beats all its competitors, and very good returns on assets and invested capital.
- Price measurements seem very low. With a P/E ratio of only 1.14, the stock is priced lower than all its industry rivals and much below the wider market norm. This matches well with Lynch's aim of finding low-priced expansion.
- Financial Condition gets an average score of 5/10. While its debt and cash ratios are stronger than many industry competitors, the Altman Z-Score implies the company is in a "grey area," meaning investors should watch its stability picture carefully.
- Expansion has been strong in the past, but missing analyst projections for future earnings and sales brings questions about the continuation of its recent results.
A Prospect for More Study
For investors using a GARP or Peter Lynch-type method, X Financial offers an interesting numerical argument. It shows the signs of a profitable company with a record of steady expansion, trading at what seems to be a deep price reduction. The small PEG ratio is especially significant, hinting that the market may not be completely seeing the company's earnings ability compared to its expansion history.
Yet, following Lynch's thinking, a search is just the first step. The small analyst attention and the company's work in China's active fintech field highlight the requirement for complete investigation. Investors must study the company's business plan, competitive position, rules, and management skill to learn the reasons for the figures and judge lasting strength.
Interested in locating other companies that match this structured investment method? You can view the complete Peter Lynch strategy search and its present findings here.
Disclaimer: This article is for information only and is not financial advice, a suggestion, or a bid to buy or sell any securities. The information shown is from supplied data and should not be the only reason for any investment choice. Investors should do their own separate study and talk with a qualified financial advisor before any investment.