
For investors looking for reliable income, a disciplined screening process is important. One useful strategy involves selecting for companies that provide an appealing dividend and also have the fundamental financial soundness to maintain and possibly increase those payments over time. This method focuses on quality and durability rather than seeking the highest available yield. By applying standards like a high ChartMill Dividend Rating, along with minimum levels for Profitability and Financial Health ratings, investors can find companies that combine income generation with business strength.
EXXON MOBIL CORP (NYSE:XOM) appears as a candidate from this kind of screening method. The integrated energy company's position as a dividend stock is useful to review using these fundamental elements.
Dividend Reliability and Sustainability
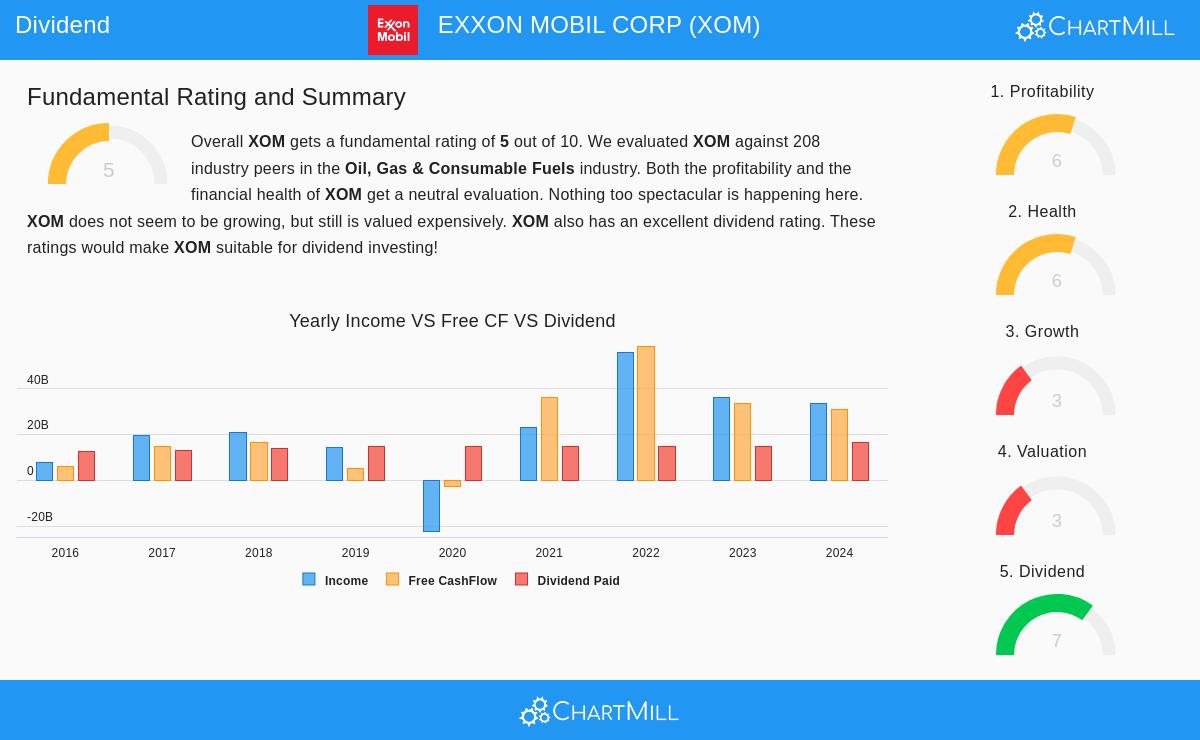
For income-oriented investors, the dividend narrative is most important, and ExxonMobil offers a case constructed on history and present measures. The company’s dividend characteristics are a primary reason it receives a firm 7 out of 10 on the ChartMill Dividend Rating.
- Track Record: ExxonMobil has a dependable history, having paid a dividend for at least 10 years without a reduction. This steadiness is a trait of companies that emphasize returning capital to shareholders across different market periods.
- Yield and Growth: The stock provides a yearly dividend yield of 3.42%, which is strong relative to the wider S&P 500 average. While the dividend’s yearly growth rate has been a moderate 3.02% over the last five years, this stable rise adds to income growth that exceeds inflation.
- Payout Safety: A vital test for durability is the payout ratio. ExxonMobil distributes 57.54% of its income as dividends. This is elevated but stays within a zone often seen as acceptable, particularly for an established, capital-intensive firm. Significantly, the fundamental review shows that earnings are increasing more quickly than the dividend, implying the present payout level can be maintained.
This mix of a good yield, a long record of consistent payments, and an acceptable payout ratio matches a dividend investment plan that prefers predictability and long-term stability over uncertain, high-yield opportunities.
Supporting Financial Health
A maintainable dividend is only as good as the company’s financial position. A minimum Health rating filter assists in steering clear of firms that could be pressured to reduce dividends because of financial stress. ExxonMobil’s Financial Health rating of 6 shows a mostly sound, though not perfect, condition.
- Strong Solvency: The company displays very good solvency measures. Its low Debt/Equity ratio of 0.13 and a firm Debt to Free Cash Flow ratio of 1.77 show it has sufficient ability to meet its commitments. An Altman-Z score of 4.11 clearly positions the company away from any short-term bankruptcy danger, doing better than many in its industry.
- Liquidity Consideration: A more detailed area is liquidity. The Current Ratio of 1.14 is sufficient, but a Quick Ratio of 0.79 indicates a more constrained situation when leaving out inventory. This is typical in the oil and gas industry because of its asset type, but it is a point investors should be aware of.
In total, the firm solvency measures supply a stable base that backs the company’s capacity to continue its dividend, even during times of commodity price swings.
Base of Profitability
Dividends are finally paid from profits. An adequate Profitability rating confirms the company is producing enough returns from its activities. ExxonMobil’s rating of 6 is backed by a number of important points.
- Consistent Cash Generation: The company has been profitable over the previous year and has kept positive operating cash flow for each of the past five years. This steady cash production is essential for paying for capital spending, debt reduction, and shareholder returns.
- Return Metrics: Its Return on Equity (11.50%) and Return on Invested Capital (7.29%) put it in the stronger portion of its industry group. While margins are generally similar to the industry average, they have displayed good progress in recent years.
This degree of profitability shows that ExxonMobil is not simply paying a dividend from debt or asset disposals but from actual, repeated operational income.
Valuation and Growth Setting
It is useful to see the dividend proposal within the complete investment context. The company’s Valuation rating of 3 implies the stock is not inexpensive, trading at a Price/Earnings ratio near the industry average but under the wider market. The Growth rating of 3 points to difficulties, with recent year-over-year drops in Earnings Per Share and Revenue, although long-term EPS growth stays firm. For a dividend investor, this setting is key: the present attraction depends significantly on the income stream and financial steadiness instead of on fast growth or deep-value traits.
A complete summary of all these fundamental points is provided in the full ChartMill Fundamental Analysis Report for XOM.
Reviewing More Dividend Ideas
ExxonMobil demonstrates the kind of company a quality-centered dividend screen can find. For investors aiming to create or vary an income portfolio, this method can produce a substantial list of possible candidates. You can execute this "Best Dividend Stocks" screen yourself and review other companies that fit comparable standards for dividend quality, profitability, and financial health by going to the pre-configured stock screener.
,
Disclaimer: This article is for informational purposes only and does not constitute financial advice, a recommendation, or an offer to buy or sell any security. The analysis is based on current data and past performance, which is not indicative of future results. Investors should conduct their own research and consider their individual financial circumstances and risk tolerance before making any investment decisions.