
Technical investors looking for breakout chances often use screening methods that mix both trend strength and entry timing. One known method involves finding stocks with good technical health using proprietary ratings systems, then adding setup quality scores that highlight consolidation patterns before possible breakouts. This two-step filter helps find securities that not only show strong momentum traits but also offer good risk-reward entry points as they leave trading ranges.
XCEL ENERGY INC (NASDAQ:XEL) appears as a notable candidate through this screening method, showing very good technical credentials along with a high-quality setup pattern that indicates possibility for further upward movement.
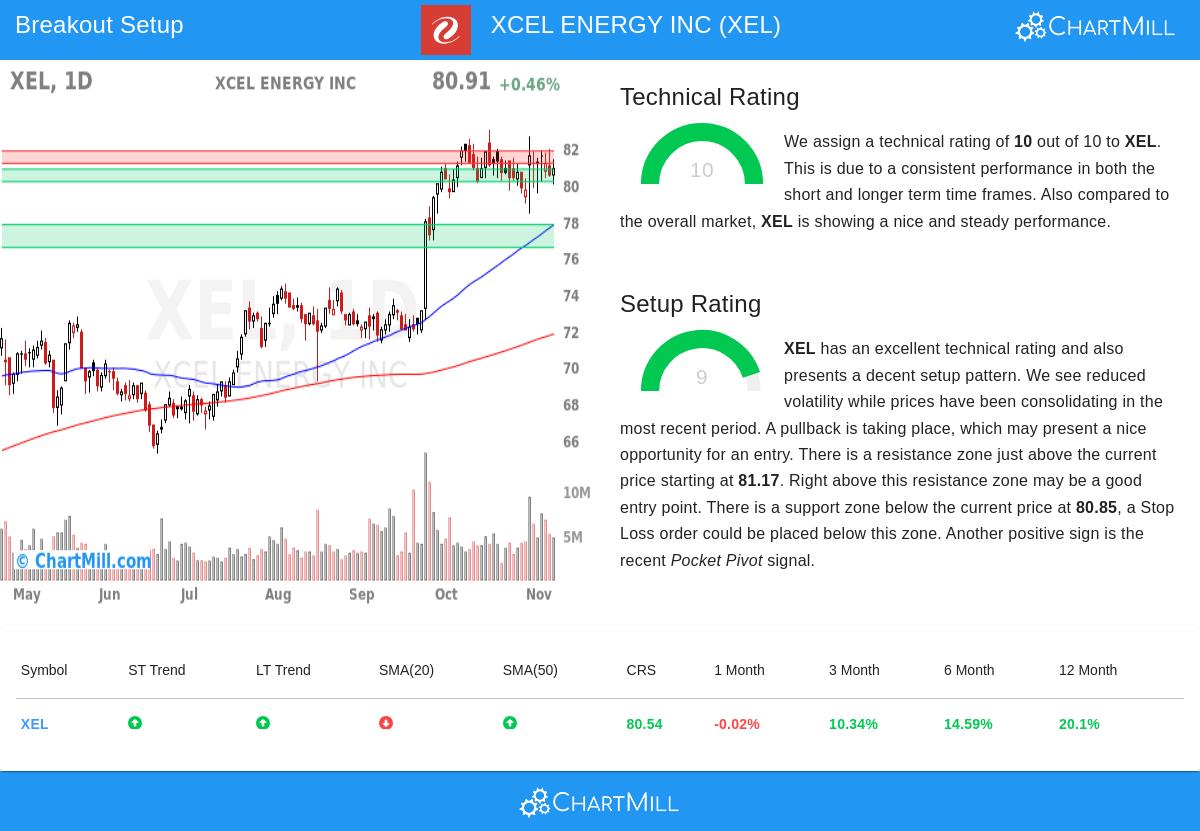
Technical Strength Assessment
Xcel Energy shows very good technical traits that place it well within the utilities sector and wider market. The stock gets a full Technical Rating of 10, showing very good trend strength and technical health across different timeframes. This top rating means better relative strength and momentum traits compared to the wider group of stocks.
Important technical traits supporting this view include:
- Both short-term and long-term trends are clearly positive
- The stock does better than 80% of all stocks on a yearly performance basis
- Steady pattern of rising prices with good positioning above several moving averages
- Trading in the upper part of its 52-week range, matching the S&P 500's current placement
The technical base stays good across different measures, with the stock trading well above its 50-day ($77.80), 100-day ($74.34), and 200-day ($71.79) moving averages. This multi-layered technical strength gives a firm base for possible breakout moves, as stocks with high technical ratings have historically shown better chance for continued upward movements.
Setup Quality Analysis
Beyond its technical quality, Xcel Energy shows a notable setup pattern with a Setup Rating of 9, meaning the stock is currently consolidating inside a clear range. This high setup score shows several good conditions for possible breakout traders.
The setup traits include:
- Recent trading kept to a close range between $78.43 and $83.01 over the last month
- Lower volatility during this consolidation time
- A forming bull flag pattern indicating possible continuation of the earlier uptrend
- Several set support zones below current prices, with the closest ranging from $80.16 to $80.85
- A recently seen Pocket Pivot signal, showing institutional accumulation
This consolidation phase makes a clear risk structure for traders, with defined support levels giving logical stop-loss placement areas. The setup shows the "when" part of the breakout strategy, finding a possible entry point after a time of price digestion following the stock's major gain.
Trading Considerations
The technical analysis report suggests a specific trading structure for those thinking about a breakout position in Xcel Energy. The identified setup proposes an entry point at $81.86, placed just above the current resistance zone between $81.17 and $81.85. This level shows a possible breakout confirmation point where the stock would pass its recent consolidation range.
Risk management parameters include:
- Stop loss placement at $80.15, below the nearest support zone
- Set risk of 2.09% on the trade
- Position sizing suggestions based on portfolio risk tolerance
Traders should note that the space between the suggested entry and exit points is about 1.04 Average True Range values, meaning a fairly close stop loss that fits the stock's recent volatility traits. The existence of several support levels below current prices gives extra confirmation of the technical strength, possibly offering additional support zones if the first level is tested.
For investors looking for similar technical breakout chances, more screening results can be found through the Technical Breakout Setups screen, which often finds securities mixing strong technical ratings with high-quality setup patterns.
Disclaimer: This analysis is based on technical indicators and historical price patterns and should not be considered investment advice. Technical analysis does not guarantee future performance and should be used as one of several tools in making investment decisions. Investors should conduct their own research and consider their risk tolerance before making any investment decisions. The provided trade setup is automatically generated and for informational purposes only.