
WELLTOWER INC (NYSE:WELL) has been identified as a Technical Breakout Setup Pattern by our stock screener. This pattern typically occurs when a stock takes a pause after a significant rise, indicating the possibility of a continuation in the trend. While it's impossible to predict with certainty, it might be beneficial to monitor NYSE:WELL.
Technical analysis of WELL
ChartMill employs a sophisticated system to assign a Technical Rating to every stock in its analysis. This rating, which ranges from 0 to 10, is determined by carefully assessing multiple technical indicators and properties.
Overall WELL gets a technical rating of 9 out of 10. This is due to a consistent performance in both the short and longer term time frames. Also compared to the overall market, WELL is showing a nice and steady performance.
- The long and short term trends are both positive. This is looking good!
- Looking at the yearly performance, WELL did better than 94% of all other stocks. On top of that, WELL also shows a nice and consistent pattern of rising prices.
- WELL is part of the Diversified REITs industry. There are 129 other stocks in this industry. WELL outperforms 96% of them.
- WELL is currently trading in the upper part of its 52 week range. The market is still in the middle of its 52 week range, so WELL slightly outperforms the market at the moment.
- In the last month WELL has a been trading in the 130.29 - 153.79 range, which is quite wide. It is currently trading near the high of this range.
Our latest full technical report of WELL contains the most current technical analsysis.
How do we evaluate the setup for WELL?
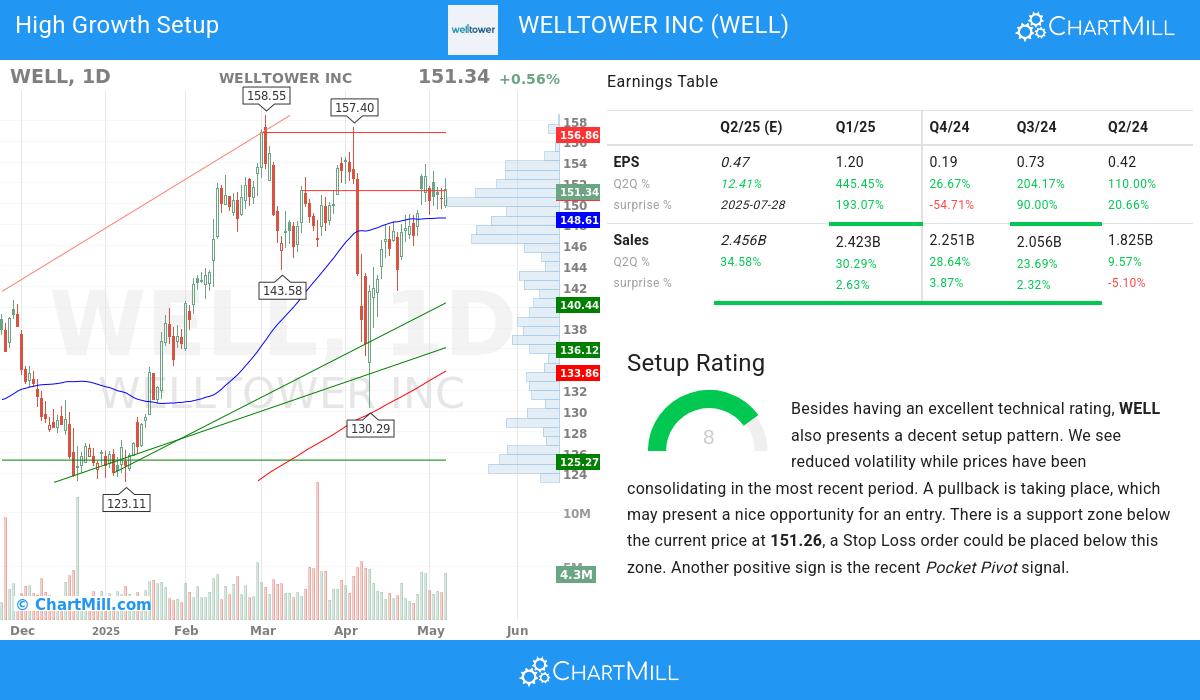
In addition to the Technical Rating, ChartMill provides a Setup Rating for each stock. This rating, ranging from 0 to 10, assesses the extent of consolidation in the stock based on multiple short-term technical indicators. Currently, WELL has a 8 as its setup rating:
WELL has an excellent technical rating and also presents a decent setup pattern. We see reduced volatility while prices have been consolidating in the most recent period. A pullback is taking place, which may present a nice opportunity for an entry. There is a support zone below the current price at 151.26, a Stop Loss order could be placed below this zone. Very recently a Pocket Pivot signal was observed. This is another positive sign.
ChartMill's Evaluation of Growth
ChartMill assigns a High Growth Momentum Rating (HGM) to every stock. This score ranges from 0 to 10 and evaluates the different growth and profitability aspects, including accelleration, surprises and revisions. WELL scores a 6 out of 10:
Explosive Earnings Growth
- WELL has shown positive momentum in its earnings per share (EPS) on a quarter-to-quarter (Q2Q) basis, with a 445.0% increase. This reflects the company's successful execution of its business strategies and its commitment to delivering improved financial results.
- WELL shows accelerating EPS growth: when comparing the current Q2Q growth of 445.0% to the previous quarter Q2Q growth of 26.67%, we see the growth rate improving.
- WELL has achieved 214.0% growth in EPS over the past 12 months, reflecting a sustained improvement in earnings performance.
- The 3-year EPS growth of WELL (25.99%) highlights the company's ability to consistently improve its earnings performance and suggests a positive outlook for future profitability.
- WELL has demonstrated strong quarter-to-quarter (Q2Q) revenue growth of 30.29%, reflecting its ability to generate consistent increases in sales. This growth highlights the company's effective market positioning and its potential for continued success.
- WELL shows accelerating Sales growth: when comparing the current Q2Q growth of 30.29% to the previous quarter Q2Q growth of 28.64%, we see the growth rate improving.
- Sales growth accelerated for 3 quarters in a row.
- WELL has achieved significant 1-year revenue growth of 23.32%, signaling its ability to capture market opportunities and drive top-line expansion. This growth indicates the company's effective execution and its potential for continued success.
Financial Strength & Profitability
- WELL has experienced growth in its profit margin over the past year, reflecting improved operational performance.
- WELL has shown positive growth in its free cash flow (FCF) over the past year, indicating improved cash generation and financial strength. This growth highlights the company's ability to effectively manage its cash flows and generate surplus funds.
- WELL has a Debt/Equity ratio of 0.49, indicating a balanced approach to financing growth.
Market Strength
- The Relative Strength (RS) of WELL has been consistently solid, with a current 94.17 rating. This highlights the stock's ability to exhibit sustained price strength and signifies its competitive advantage.
Our High Growth Momentum Breakout screen will find you more ideas suited for high growth momentum breakouts.
Disclaimer
This article should in no way be interpreted as advice. The article is based on the observed metrics at the time of writing, but you should always make your own analysis and trade or invest at your own responsibility.