
A possible breakout setup was detected on WELLTOWER INC (NYSE:WELL) by our stockscreener. A breakout pattern is formed when a stock consolidates after a strong rise up. We note that this pattern is detected purely based on technical analysis and whether the breakout actually materializes remains to be seen. It could be interesting to keep an eye on NYSE:WELL.
Insights from Technical Analysis
Every day ChartMill assigns a Technical Rating to every stock. The score ranges from 0 to 10 and is determined by evaluating multiple technical indicators and properties.
Overall WELL gets a technical rating of 10 out of 10. This is due to a consistent performance in both the short and longer term time frames. Also compared to the overall market, WELL is showing a nice and steady performance.
- Both the short term and long term trends are positive. This is a very positive sign.
- Looking at the yearly performance, WELL did better than 86% of all other stocks. We also observe that the gains produced by WELL over the past year are nicely spread over this period.
- WELL is one of the better performing stocks in the Diversified REITs industry, it outperforms 89% of 129 stocks in the same industry.
- WELL is currently trading near its 52 week high, which is a good sign. The S&P500 Index however is also trading near new highs, which makes the performance in line with the market.
- WELL is currently showing a bull flag pattern! A bull flag pattern occurs when prices pull back slightly after a strong rise up. This may be a nice opportunity for an entry.
Our latest full technical report of WELL contains the most current technical analsysis.
Why is NYSE:WELL a setup?
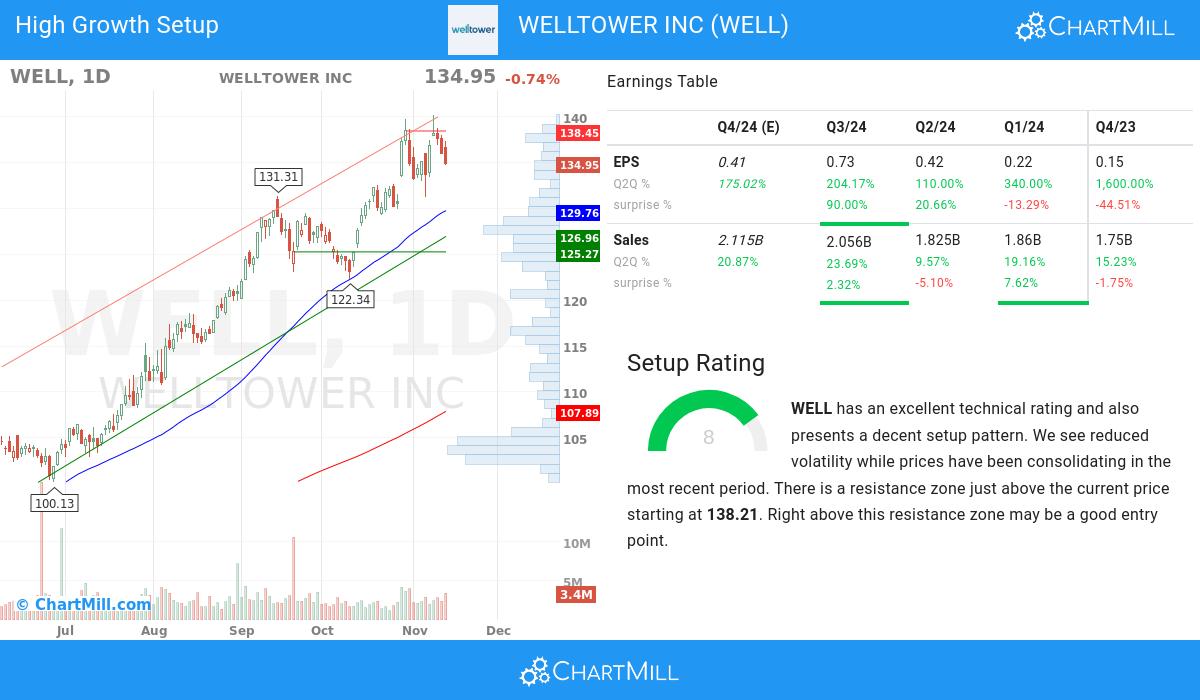
Next to the Technical Rating, the Setup Rating of a stock determines to which extend the stock is consolidating. This score also ranges from 0 to 10 and is updated daily. The setup score evaluates various short term technical indicators. For NYSE:WELL this score is currently 8:
WELL has an excellent technical rating and also presents a decent setup pattern. We see reduced volatility while prices have been consolidating in the most recent period. There is a resistance zone just above the current price starting at 138.21. Right above this resistance zone may be a good entry point.
What matters for high growth investors.
- The recent financial report of WELLTOWER INC demonstrates a 204.0% increase in quarterly earnings compared to the previous quarter. This growth indicates positive momentum in the company's financials and suggests a promising upward trend
- WELLTOWER INC has achieved 23.69% growth in its revenue over the previous quarter, signaling positive momentum in its financial performance and potential market opportunities.
- In the most recent financial report, WELLTOWER INC reported a 204.0% increase in quarterly earnings compared to the previous quarter. This notable growth indicates positive momentum in the company's financials, suggesting an upward trend
- With positive growth in its operating margin over the past year, WELLTOWER INC showcases its ability to improve profitability through effective cost control and operational efficiency. This growth underscores the company's commitment to enhancing its financial performance.
- The free cash flow (FCF) of WELLTOWER INC has seen steady growth over the past year, indicating enhanced cash flow generation and financial health. This trend underscores the company's effective capital management and its ability to generate sustainable cash flows.
- With a Debt-to-Equity ratio at 0.52, WELLTOWER INC showcases its prudent financial management. The company's balanced approach between debt and equity reflects its commitment to maintaining a stable capital structure.
- WELLTOWER INC has maintained a healthy Relative Strength (RS) over the analyzed period, with a current 86.4 rating. This demonstrates the stock's ability to outperform its peers and indicates its competitive positioning. WELLTOWER INC is well-positioned for potential price growth opportunities.
More ideas for high growth momentum breakouts can be found on ChartMill in our High Growth Momentum Breakout screen.
Disclaimer
This article should in no way be interpreted as advice. The article is based on the observed metrics at the time of writing, but you should always make your own analysis and trade or invest at your own responsibility.