
A common challenge for investors is identifying companies with strong basic business growth that are also at a good technical point for entry. One method to address this is by screening for stocks that show solid fundamental growth traits while also presenting hopeful technical breakout patterns. This joined method aims to match a company's financial momentum with positive market feeling, possibly finding chances where getting better basics are starting to be seen by the market. Vertex Pharmaceuticals Inc (NASDAQ:VRTX) recently appeared from such a screen, which looks for stocks showing solid growth, acceptable financial health and earnings, and a high technical setup score showing a possible breakout.
Fundamental Growth Profile
The center of this screening plan is first finding companies with clear and anticipated financial increase. Vertex’s fundamental report features a company in a strong growth stage. Its ChartMill Growth Rating is a firm 7 out of 10, backed by notable numbers.
- High Earnings Growth: The company's Earnings Per Share (EPS) rose by over 3,300% in the past year. While this is partly from a low starting point in earlier times, it shows a major turn in earnings.
- Solid and Steady Revenue Increase: More lastingly, Vertex has increased its revenue by 10.33% over the last year and at a typical yearly speed of 21.50% over recent years. This top-line growth is powered by its leading place in cystic fibrosis (CF) treatments and the good start of its new drug for sickle cell disease and beta thalassemia.
- Strong Future Outlook: Experts predict this motion to keep going, with expected yearly EPS growth of 150.51% and revenue growth of 9.75% in the next years. For a growth stock, these future guesses are key, as they support investor hope about the company's pipeline and market growth.
This growth is not happening with loss of financial steadiness. Vertex has a clean balance sheet with no debt, adding to a firm financial health rating. Also, its earnings are very good, with profit margins and returns on capital that are in the high group of the competitive biotechnology field. This mix of high growth, top earnings, and a strong balance sheet forms an engaging basic picture that fits the main needs of the screening plan.
Valuation Context
While the screen centers on growth and technicals, valuation gives needed background. Vertex shows an interesting case. Its Price-to-Earnings (P/E) ratio of about 27 might look high in simple terms, but it is key to see this through its field and growth speed.
- Field Comparison: Vertex trades at a notable lower price than its biotech field peers, which have an average P/E above 57. It costs less than about 93% of the companies in its area.
- Growth Adjustment: When its high growth speed is included via the PEG ratio, the valuation seems more fair. The fundamental report states that the company's "low PEG Ratio... shows a rather inexpensive valuation of the company" given its earnings path.
This valuation setting is key for the growth stock idea. It hints the market may not yet be fully counting the company's future growth possibility, or that its current higher price is supported by its field-leading earnings and clear growth path.
Technical Breakout Setup
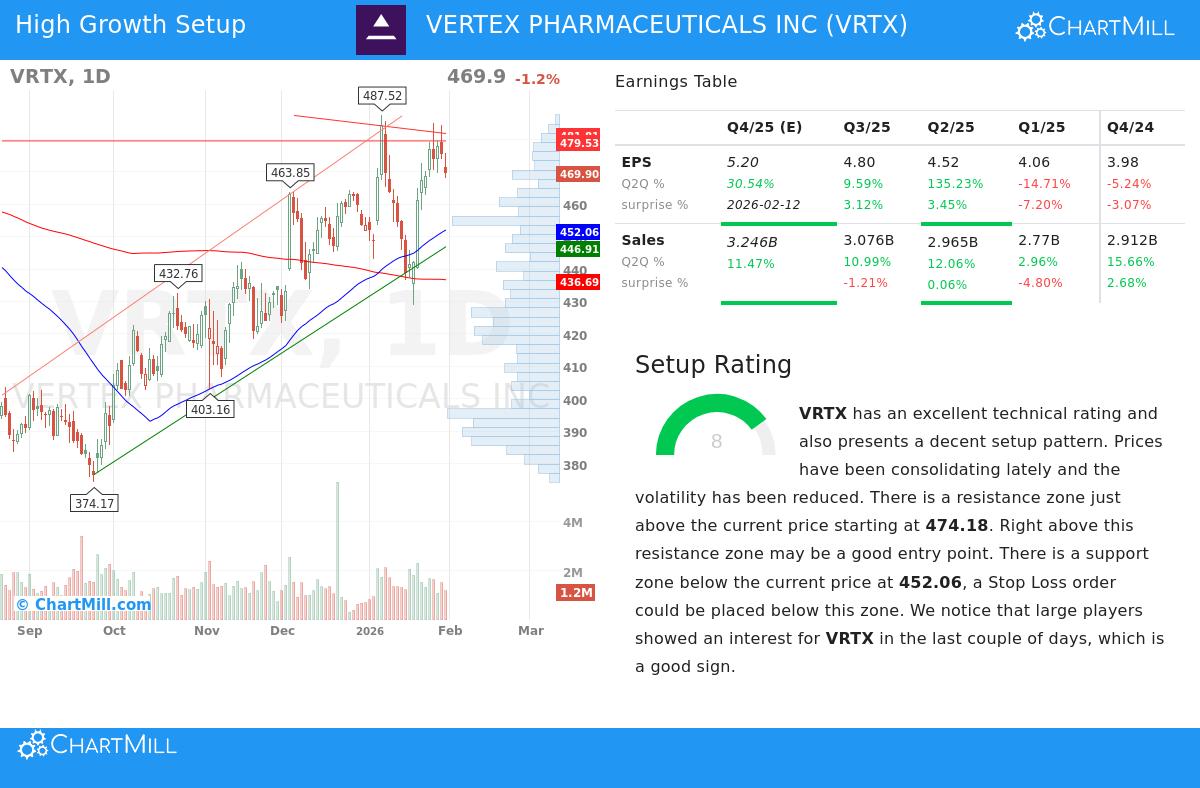
The second part of the screening method is finding a good technical setup, where the stock's price movement hints at gathering force and a possible move upward. Vertex’s technical analysis report gives a high score of 8 out of 10, with a matching setup score of 8, pointing to a helpful chart pattern.
- Positive Trend Agreement: Both the long-term and short-term trends for VRTX are scored as positive. The stock is trading above its main moving averages (20-day, 50-day, and 100-day SMAs), which are all in an upward line, confirming the upward motion.
- Narrowing Near Resistance: The report notes that prices have been "moving in a tight range recently," which may present a good entry chance. The stock is now testing a set resistance area between about $474 and $482. A clear move above this area could signal the next step up and confirm the breakout idea.
- Clear Risk Limits: The technical setup finds a nearby support area around $452, below the present price. This gives a sensible level for a stop-loss order, allowing for set risk control, a key part of any trade plan based on technical patterns.
You can see the full chart study and exact price levels in the complete technical report for VRTX.
Analyst Views and Market Place
Beyond the number scores, Vertex’s story-based place backs the growth story. The company is a frontrunner in its main market of cystic fibrosis, with a group of treatments that hold leading market share. Its recent move into treating sickle cell disease shows a successful entry into a new, big target market. The company’s full pipeline, aiming at conditions like type 1 diabetes and APOL1-mediated kidney disease, gives view for long-term growth past its present top products. Leadership has steadily shown skill to create, start, and sell highly working treatments, turning science invention into financial results.
Conclusion
Vertex Pharmaceuticals presents a case where solid fundamental growth numbers and a helpful technical setup meet. The company’s high earnings growth, firm revenue path, and very good earnings complete the "solid growth" part of the screen. At the same time, its positive price trends, narrowing near resistance, and high technical setup score meet the "good technical setup" filter. This agreement suggests that the company’s strong business performance may be set to start an upward technical breakout.
For investors using a growth-with-motion plan, VRTX shows a candidate deserving of more study. Its mix of financial might, market leadership, and hopeful chart action captures the kind of chance this joined screening method aims to find.
Interested in finding other stocks that fit this profile? You can run the "Strong Growth Stocks with good Technical Setup Ratings" screen yourself to see the newest results here.
, Disclaimer: This article is for information only and does not make financial advice, a suggestion, or an offer or request to buy or sell any securities. The study is based on data and reports given by ChartMill, and past results are not a sign of future outcomes. Investors should do their own study and talk with a skilled financial advisor before making any investment choices.