
For investors focused on price action and chart patterns, a methodical way to spot possible breakouts can make finding chances simpler. One technique is to look for stocks that show both good basic technical condition and a distinct, usable setup pattern. The idea is simple: a stock in a verified uptrend that starts to trade in a narrow range after a rise may be getting ready for its next upward move. By using a high "Technical Rating" to measure trend force with a high "Setup Quality Rating" to spot this tight trading, traders try to find times when a stock's forward motion is probable to continue.
Vertex Pharmaceuticals Inc (NASDAQ:VRTX) recently appeared from such a scan, showing a profile that technical investors may see as interesting. The biotechnology company, recognized for its work on cystic fibrosis treatments and its growing research projects, is displaying orderly price action that fits this breakout approach.
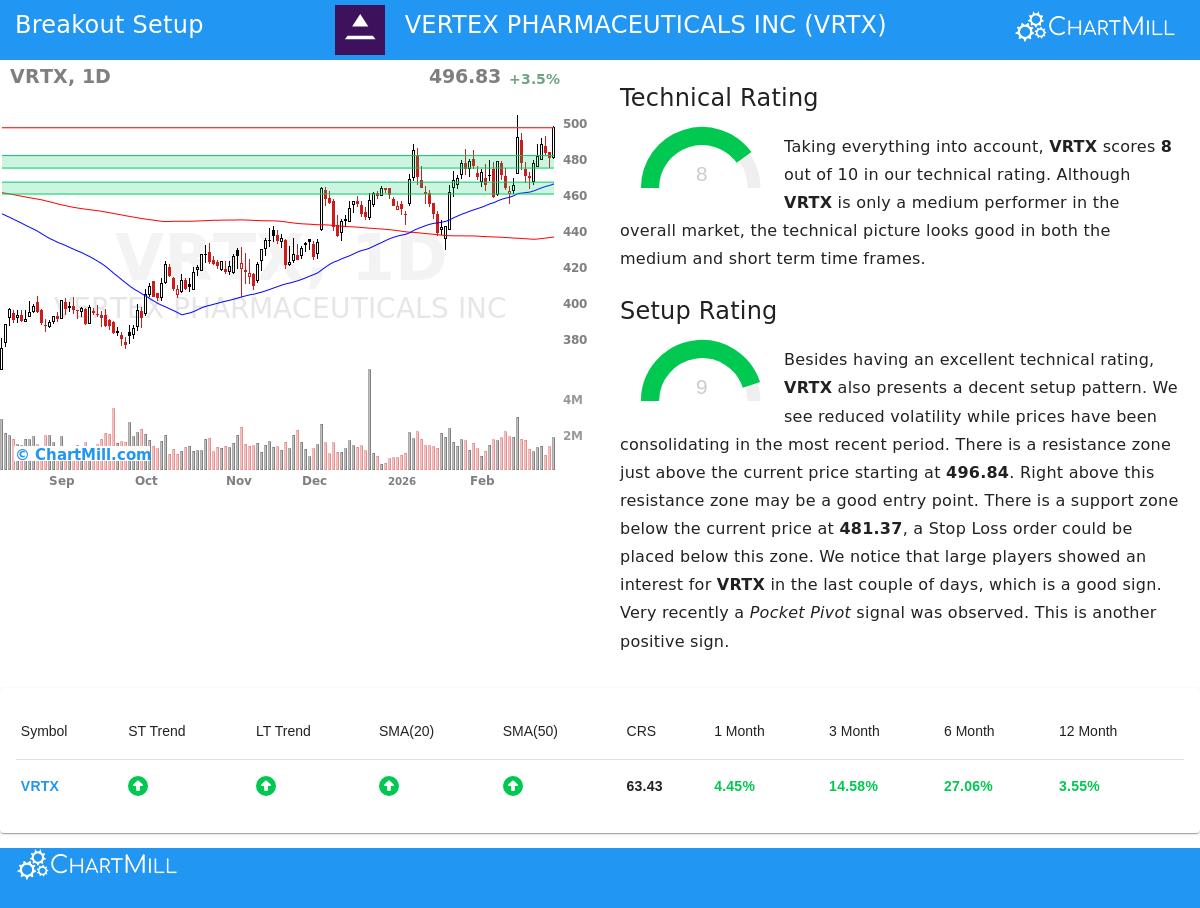
Looking at the Technical Condition
The base of this method is a stock's technical condition, which for VRTX is scored a firm 8 out of 10. This number shows the stock's place inside a good trend. A closer review of the technical report affirms several positive factors:
- Trend Agreement: Both the long-term and short-term trends for VRTX are scored as up. This agreement across different periods is a typical mark of a sound, continuing rise.
- Moving Average Backing: The stock is priced above all its main simple moving averages (20, 50, 100, and 200-day), and each of these averages is itself moving upward. This forms a stacked base of support below the present price.
- Performance Background: Over the last six months, VRTX has gained over 27%, doing much better than its small 12-month gain of about 3.5%. This points to a recent and marked increase in the stock's upward move.
This firm technical rating is key because it selects for stocks with confirmed forward motion. Buying into a breakout is naturally a momentum plan; the aim is to join an existing upward move, not to predict when a fall might stop.
Reviewing the Setup Condition
While a firm trend is needed, it is not enough for a good entry point. A stock that has risen quickly and become "overstretched" can be likely to decline. This is where the Setup Quality score, which for VRTX is a high 9, becomes important. It finds times of tight trading or limited price movement inside the larger uptrend, indicating the stock is pausing before a possible next step.
The technical report points out the traits that lead to this high setup score:
- Tight Trading Near Highs: VRTX has been moving in a band between about $454 and $504 over the past month and is now placed in the upper part of this band. This shows managed price action after a previous rise.
- Clear Support and Resistance: The analysis marks a definite resistance area just above the current price at $496.84. At the same time, a set support area exists near $481.37, made by a combination of moving averages and trend lines. This forms a clear trading band.
- Supportive Technical Signs: The report mentions recent "Pocket Pivot" activity, a volume-related sign that often points to buying by large investors, adding another point of confirmation to the price consolidation.
A high Setup Quality rating speaks to the "when" of the investment idea. It indicates the stock is not overbought but is instead forming a base, giving a clearer point for entry (a move above resistance) and a sensible point for risk control (a stop loss below support).
A Possible Technical Picture
From this review, a standard technical picture forms. The nearby resistance at $496.84 becomes a sensible trigger point for a breakout. A continued move above this level could mark the restart of the uptrend, with the recent tight trading acting as a base for the next move. The stacked support area starting near $481 gives a technical zone to set a protective stop, setting the trade's risk. The space between this entry and exit point is about 4.5%, allowing for simple position sizing.
Locating Comparable Chances
The mix of a firm trend and a high-condition setup is what makes VRTX a prospect for technical investors using this breakout method. For traders looking to search the market for like patterns, this plan can be used methodically. A ready-made scan that selects for stocks with a Technical Rating >= 7 and a Setup Quality Rating >= 7 can effectively create a daily list of possible breakout prospects.
You can see today's results from this Technical Breakout Setups scan here.
Disclaimer: This article is for information only and is not investment advice, a suggestion, or an offer or request to buy or sell any securities. The technical review and possible trade setup described come from automated reports and past data, which are not promises of future results. All investing and trading has risk, including the chance of losing the money you start with. Always do your own research, think about your money situation and risk comfort, and talk with a qualified financial advisor before making any investment choices.