
VERTEX PHARMACEUTICALS INC (NASDAQ:VRTX) has appeared as a notable candidate from a screening method that mixes firm fundamental growth measures with encouraging technical breakout formations. This method tries to find companies with sound basic business condition and earnings, along with share price movement hinting at possible upward movement. By concentrating on businesses that show quickening profits, firm financial bases, and technical formations pointing to stability or new breakouts, investors try to seize chances where both numerical basics and market timing match well.
Fundamental Condition and Growth Measures
The fundamental examination report for Vertex Pharmaceuticals shows a company with outstanding financial condition and earnings, scoring 7 and 8 out of 10 respectively in these areas. These scores are important in growth investing, as they show the company’s capability to maintain increase without cash or debt issues, while effectively turning sales into profits. Important points from the report include:
- Return on Equity of 21.18%, doing better than 95.75% of others in the industry.
- Operating Margin of 38.77%, placed in the top 2% of the biotechnology field.
- Sales increase averaging 21.50% each year over recent years, with predicted future EPS increase of 150.73% per year.
These measures show why Vertex matches the growth stock description: it works in the large biotechnology market, focusing on serious illnesses with new treatments, and it shows a capability to not only increase quickly but do so with good earnings. The company’s absence of debt and firm cash flows further support its ability to put money into future growth projects, like its work in cystic fibrosis, sickle cell disease, and other areas. For a complete breakdown, readers can see the full fundamental analysis report.
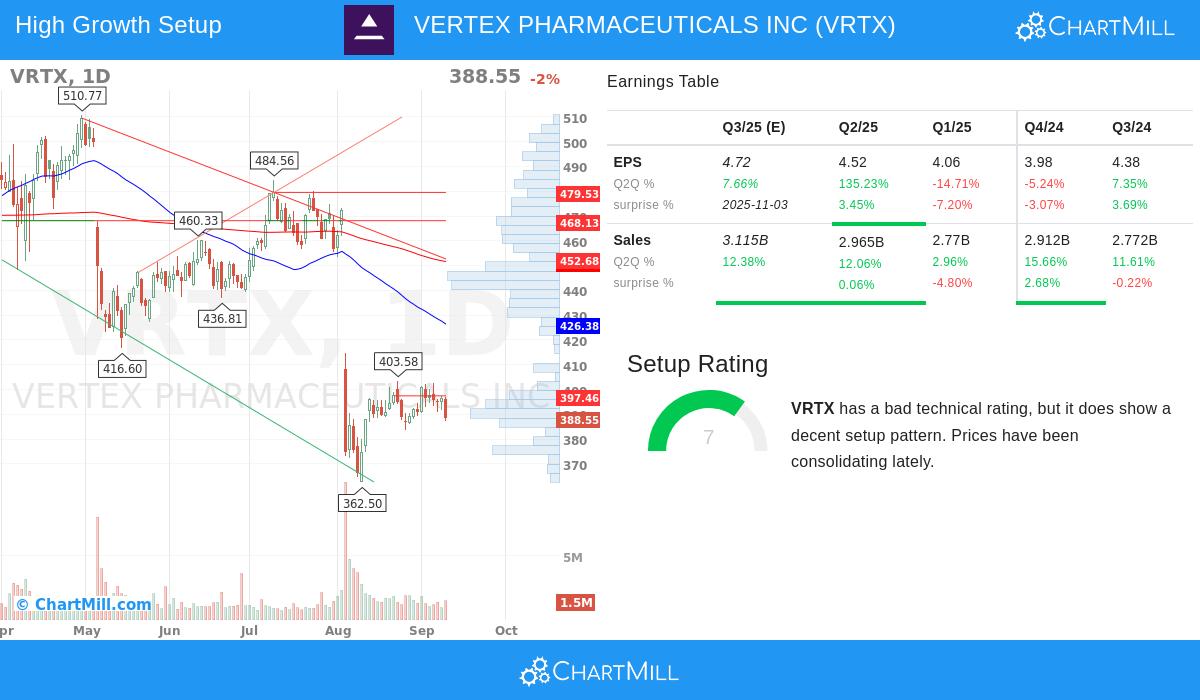
Technical Formation and Breakout Possibility
From a technical viewpoint, Vertex shows a significant formation even with a lower total technical rating of 1/10, which mostly shows recent weaker performance compared to the wider market. However, the formation rating of 7/10 points to a stability pattern that frequently comes before breakouts. The stock has been moving in a small band between $383 and $403 lately, forming a base close to support near $366.53. This action hints at gathering and possible force for an upward move, particularly if it can pass near-term barrier areas, the nearest being between $393.29 and $401.01.
The existence of a stability phase is important because it frequently shows a time of balance between purchasers and sellers, which can end in a clear direction. For growth stocks like Vertex, a breakout above barrier could indicate returned investor belief in its growth path, especially when combined with firm fundamentals. The technical examination, available in detail here, gives more understanding of these formations and important points to follow.
Matching with Growth Investing Method
This joined fundamental and technical screening method is made to find stocks that not only have firm growth outlooks but are also at a turning point regarding price movement. Vertex shows this by displaying:
- Better growth in profits and sales, key for capital gain.
- High earnings and financial condition, lowering investment risk.
- A technical formation hinting at possible movement change, giving a good entry chance.
The focus on these standards comes from the main ideas of growth investing, where investors look for companies able to do better than others and the market. By making sure these businesses are also technically set for gains, the method tries to better timing and improve the risk-return condition.
Finding Like Chances
For investors curious about finding other stocks that meet similar standards of firm growth, sound fundamentals, and encouraging technical formations, more screening outcomes can be found using this custom stock screener. This tool allows more search of possible chances in the present market setting.
Disclaimer: This article is for informational purposes only and does not constitute investment advice. Investors should conduct their own research and consider their financial situation and risk tolerance before making any investment decisions.