
Investors aiming to benefit from major price increases often use a method that combines solid business performance with positive chart formations. This method looks for firms showing strong basic growth, marked by rising sales and profits, while also displaying chart formations that indicate a possible move out of a period of sideways trading. The logic is simple: a firm with very good growth numbers supplies the basic force for a continued price rise, while a positive chart formation can indicate the best time to enter, just as the stock gains speed to rise.
Vertiv Holdings Co-A (NYSE:VRT) appears as a strong prospect from this kind of screening method. The company, a worldwide supplier of important digital infrastructure technology for data centers and communication networks, operates directly in the high-growth area of digitalization and AI-driven computing needs.
Basic Growth Driver
The main attraction of Vertiv is its forceful basic growth picture, which fits exactly with the method's need for a solid operating business. According to ChartMill's basic analysis report, Vertiv receives a high Growth score of 8 out of 10. This score is backed by outstanding recent results and positive future estimates.
- Strong Past Growth: Over the last year, Vertiv's Earnings Per Share (EPS) rose by 57.85%, while Revenue increased by a notable 28.76%. This shows the company's capacity to benefit from solid market demand.
- Continued Speed: The growth is not limited to one quarter. The company displays solid multi-year patterns, with EPS increasing at a yearly rate of 55.36% and Revenue at 12.57% over recent years.
- Increasing Forecast: Possibly most key, analysts expect this speed to persist. Revenue is forecast to grow by 18.03% each year in the future, showing an increase from the historical pattern.
This solid growth is also backed by very good profitability (a score of 8/10) and firm financial condition (a score of 7/10). High returns on equity and invested capital, along with widening profit margins, describe a company that is not only increasing sales, but doing so effectively and profitably. For a growth investment method, these traits are important as they indicate the company has a lasting competitive edge and the financial strength to support its growth.
Chart Formation for a Possible Move
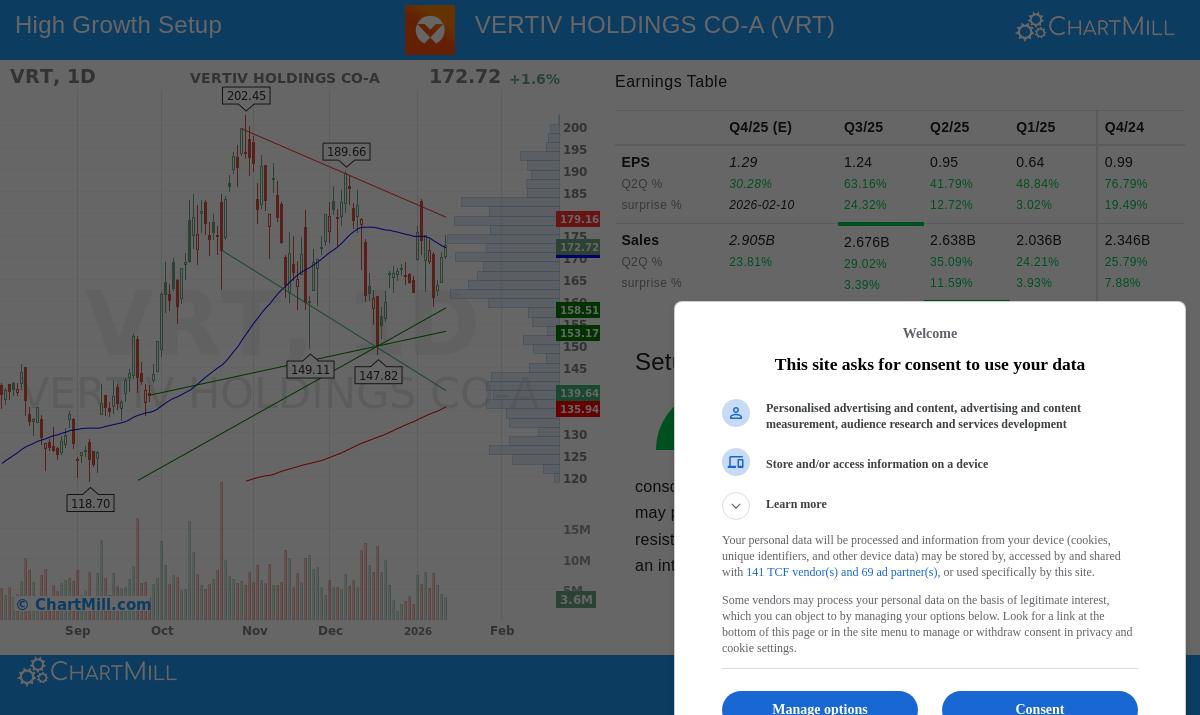
While basics supply the reason, chart study can give clues about the timing. Vertiv's present chart formation shows what chart analysts call a period of sideways trading inside a longer-term rising trend, often a sign of another rise ahead. ChartMill's chart analysis report notes a Setup Score of 8 out of 10, pointing to a positive situation.
- Sideways Trading in a Rising Trend: The long-term direction for VRT is clearly positive. After a strong rise, the stock has been trading between about $148 and $183 over the past month. This time of sideways trading has let the stock absorb its earlier gains and lower price swings.
- Important Support and Resistance: The chart report points out several key support levels below the present price, including an area around $165-$169 made by important average lines. This forms a possible zone where buying activity may rise. Immediate resistance is seen near $179, with more major resistance higher at $189 and $193.
- Setup Situation: The analysis states that "prices have been trading sideways lately and the price swings have been reduced. A decline is happening, which may give a good chance for an entry. There is very little resistance above the current price." This describes a typical breakout situation where a stock pauses after a strong move, gathering force for a possible rise past overhead resistance levels.
Price Consideration
It is key to see that high growth often carries a higher price. Vertiv's Price-to-Earnings (P/E) ratio is high compared to the wider S&P 500. However, its price is more moderate next to its industry group, and measures like the Price-to-Free-Cash-Flow ratio show a somewhat low price within its sector. More importantly, the company's low PEG ratio, which includes its high growth rate, suggests the present price may be reasonable given its future profit potential. For growth investors, paying a higher price for outstanding and lasting growth is a considered part of the method.
Summary
Vertiv shows a situation where a strong basic growth narrative meets a positive chart formation. The company's leading place in the necessary digital infrastructure market is causing outstanding sales and profit growth, meeting the central idea of growth investing. At the same time, its stock chart displays a period of sideways trading inside a strong rising trend, giving a clear chart situation that growth-focused traders often look for to time their investments.
Interested in locating other stocks that mix solid growth with positive chart formations? You can use the "Strong Growth Stocks with good Technical Setup Ratings" screen yourself with this pre-set link to review more possible options.
Disclaimer: This article is for information only and does not form financial guidance, a suggestion, or an offer or request to buy or sell any securities. The information shown is based on supplied data and should not be the only ground for any investment choice. Investing carries risk, including the possible loss of original capital. Always do your own research and think about talking with a qualified financial consultant before making any investment choices.