
In growth investing, joining a solid technical plan with detailed fundamental study can be an effective way to find possible market leaders. One organized method that represents this idea is the strategy made known by trader Mark Minervini. His system rests on two main parts: the Trend Template, which finds stocks in strong, confirmed uptrends, and a concentration on excellent fundamental growth, looking for companies with quickening earnings and sales. This two-part method tries to find stocks with good momentum that is supported by better business results, placing them for possible further strong performance.
VERTIV HOLDINGS CO-A (NYSE:VRT) stands as a present example that seems to match this joined strategy. The company, a supplier of essential digital infrastructure for data centers and communication networks, works directly inside the high-need field of technology and industrial electrification.
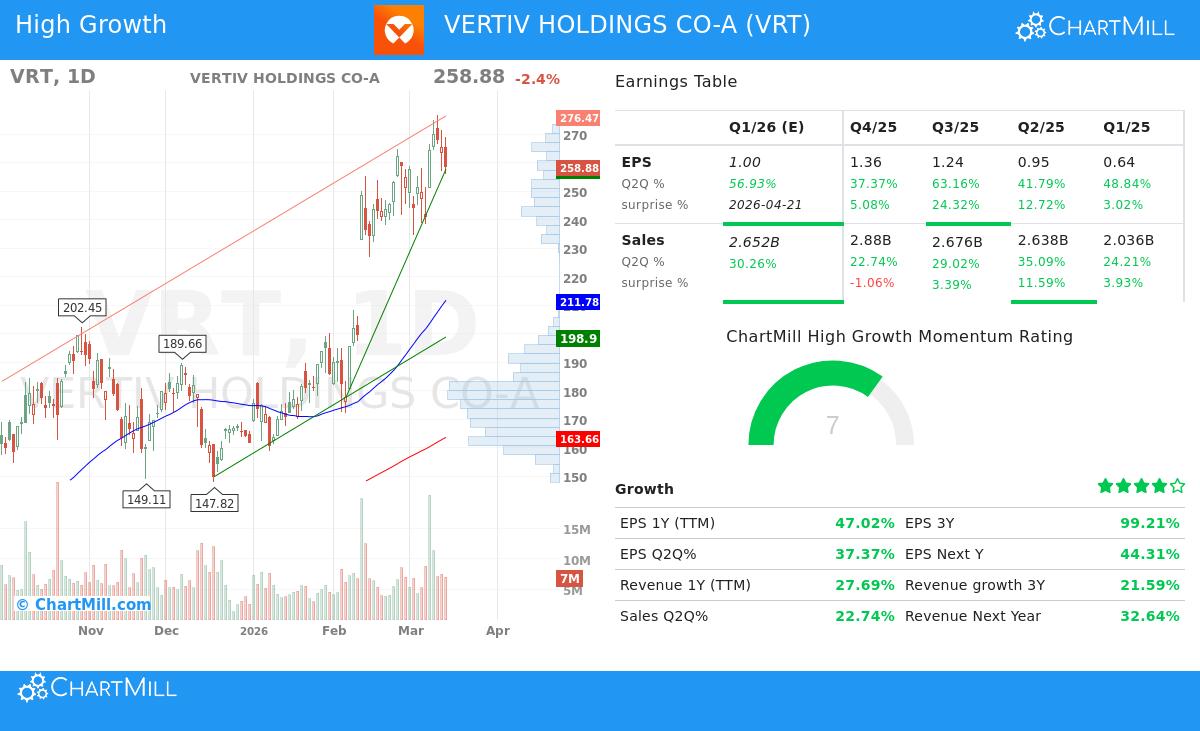
Technical Strength: Matching the Minervini Trend Template
The Minervini Trend Template is made to sort for stocks showing clear technical strength, making sure an investor buys into a current uptrend instead of trying to find a bottom. VRT's chart and technical numbers now meet the main conditions of this template, which is a requirement in the filtering step that found the stock.
- Price Above Key Moving Averages: VRT's last price of $258.88 trades well above its rising 50-day ($211.78), 150-day ($176.77), and 200-day ($163.66) simple moving averages (SMAs). This order confirms the stock is in a held uptrend across several timeframes.
- Moving Average Order: The 50-day SMA is above both the 150-day and 200-day SMAs, and the 150-day SMA is above the 200-day SMA. This step-by-step positive order of shorter-term averages above longer-term ones is a standard sign of increasing momentum, a key feature of Minervini's stage 2 uptrends.
- Nearness to Highs: The stock is trading within 7% of its 52-week high of $276.78, meeting the template's need to be within 25% of the yearly high. This shows the stock is displaying strength and leading, not following.
- Major Recovery: VRT's present price is about 383% above its 52-week low of $53.60, well past the template's 30% limit. This shows a strong recovery and trend change has already been confirmed.
- Better Relative Strength: With a ChartMill Relative Strength (CRS) score of 98.02, VRT is doing better than almost all other stocks in the market over the past year. High relative strength is an important filter in the Minervini strategy, as it finds market leaders that often lead in both rising and falling markets.
Fundamental Momentum: The Argument for High Growth
While the Trend Template makes sure a stock is technically good, the "High Growth Momentum" part of the screen tries to check that the price momentum is supported by outstanding business results. Minervini's work shows that the largest stock market winners are nearly always joined by solid, and often quickening, fundamental growth. VRT's recent financial numbers indicate it matches this description.
- Earnings Growth Quickening: The company is not only growing earnings; the speed of growth seems solid. Year-over-year EPS growth for the last reported quarter was 37.4%, which comes after earlier quarters showing growth of 63.2% and 41.8%. This sequence of solid step-by-step growth is a good sign. For the full trailing twelve months (TTM), EPS grew 47%.
- Steady Earnings Surprises: VRT has exceeded analyst EPS estimates in each of the last four quarters, with an average beat of 11.3%. Steady positive surprises can push upward changes and draw institutional attention, a main catalyst Minervini looks for.
- Growing Profit Margins: Getting better profitability is a key feature of a high-quality growth company. VRT's profit margin has grown notably, from 8.1% three quarters ago to 15.5% in the most recent quarter. This direction of growing margins suggests operational efficiency and pricing ability.
- Solid Revenue Growth: Top-line growth stays strong, with last quarter's sales up 22.7% year-over-year, after quarters of 29.0% and 35.1% growth. TTM revenue growth is at 27.7%, showing held demand for its infrastructure solutions.
- Positive Analyst Changes: Analysts are increasing their expectations, a main momentum sign. The average estimate for next year's EPS has been changed upward by 14.3% over the last three months, and revenue estimates are up 10.7%. These upward changes often come before more price gains.
Technical Condition and Setup Summary
Beyond the exact Trend Template filters, ChartMill's own analysis gives a wider look at VRT's technical condition. The stock gets a perfect Technical Rating of 10 out of 10, showing outstanding strength across all measured numbers, including long and short-term trends, volume patterns, and industry-relative performance. The long-term trend is rated positive, which matches the solid moving average picture, while the short-term trend is also positive.
The technical report also notes a Setup Rating of 7, showing that after its major rise, the stock has moved into a phase of consolidation with lower volatility. The report finds clear support areas, most notably around $257.19, and points out a recent "Pocket Pivot" signal, a volume-based sign suggesting accumulation. This mix of high technical condition with a consolidating setup can offer a planned chance for investors, as defined support levels allow for clearer risk management. You can see the full, detailed technical analysis for VRT here.
Conclusion and Further Study
VERTIV HOLDINGS CO-A offers a strong example of a stock that now meets the strict technical conditions of the Minervini Trend Template while also showing the fundamental signs of a high-growth momentum company. Its strong price trend is supported by quickening earnings, growing margins, and solid analyst opinion, creating a combination of elements that growth-focused strategies often look for.
It is key to recall that past results do not show future results, and even strong setups have risk, especially after a near-200% yearly gain. The wider market situation, with the S&P 500's long-term trend now negative, calls for care and highlights the need for strict risk management, including the use of stop-loss orders as described in the Minervini system.
For investors looking to find other possible examples that join technical trend strength with high-growth fundamentals, you can use the "High Growth Momentum + Trend Template" screen directly on ChartMill here.
Disclaimer: This article is for information and learning only. It is not meant as investment advice, a suggestion, or an offer or request to buy or sell any securities. The study is based on given data and does not make up a full review of all material facts. Investing has risk, including the possible loss of principal. Always do your own study and talk with a qualified financial advisor before making any investment choices.