
Investors frequently look for stocks that blend strong earnings momentum with positive technical setups, a method highlighted by strategies such as CANSLIM and Minervini. These methods focus on finding companies with growing performance while also identifying good entry points using technical analysis. Vertiv Holdings Co-A (NYSE:VRT) stands out as a stock that meets both criteria, with a High Growth Momentum (HGM) Rating of 6, a Technical Rating of 10, and a Setup Rating of 8. This mix indicates the stock shows solid fundamental growth and may be ready for a breakout.
Fundamental Growth Momentum
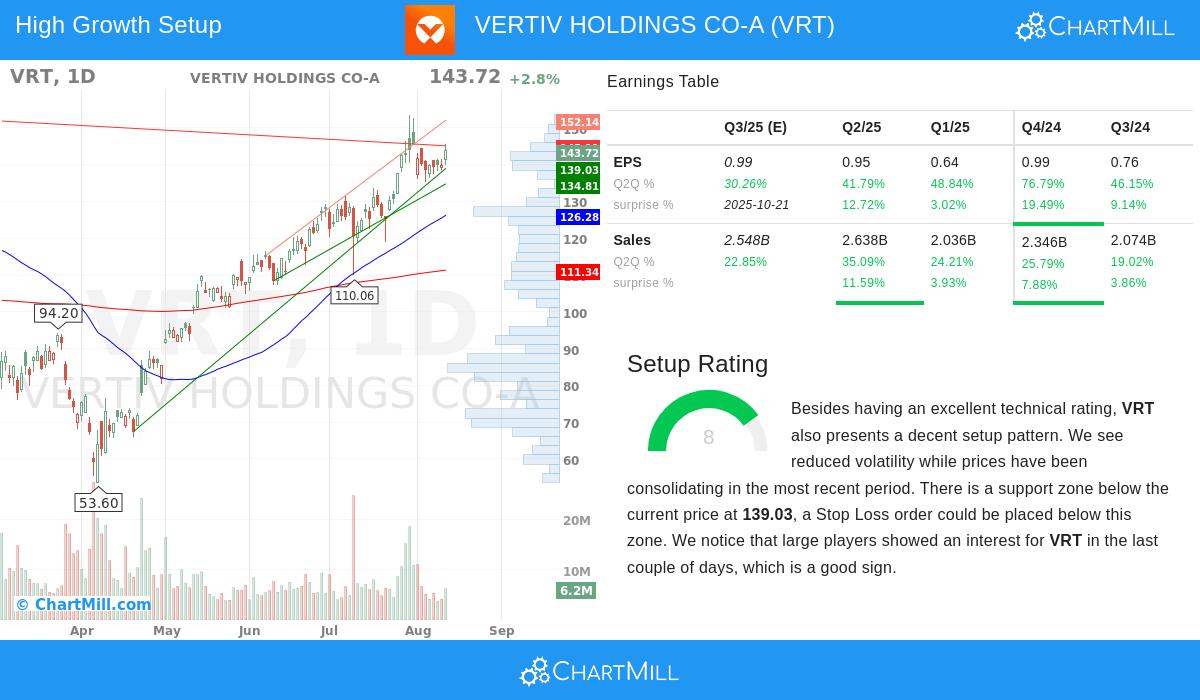
Vertiv’s growth matches the metrics important to investors focused on high growth:
- Earnings & Revenue Growth: The company posted a 53.2% year-over-year EPS increase (TTM) and a 26.3% rise in revenue over the same period. Recent quarterly EPS growth was 41.8%, with sales up 35.1% compared to the previous year. These numbers show ongoing momentum, a key factor for growth strategies.
- Free Cash Flow Increase: Free cash flow per share jumped 246.5% over the past year, highlighting better operational efficiency and financial strength.
- Profit Margin Growth: Vertiv’s profit margin grew to 12.3% in the latest quarter, up from 8.1% in the prior quarter, indicating higher profitability.
- Consistent Earnings Beats: The company has surpassed EPS estimates in each of the last four quarters by an average of 11.1%, showing it can outperform expectations.
These metrics are key to the HGM Rating, which measures growth speed, revisions, and surprises—all signs of a company likely to keep performing well.
Technical Strength & Setup Quality
Vertiv’s technical profile adds to its appeal:
- Top Technical Rating (10/10): The stock is in a strong upward trend across short- and long-term periods, with prices well above key moving averages (20-day, 50-day, 100-day, and 200-day SMAs). The stock has outperformed 93% of the market over the past year, showing strong relative performance.
- Bull Flag Pattern: The recent pause after a sharp rise forms a bull flag, a pattern often followed by further gains.
- Support & Resistance Levels: A clear support area lies between $134.81 and $139.03, backed by moving averages and trendlines. A move above resistance at $145.11,$146.33 could signal more upside.
- Lower Volatility: The setup rating of 8 reflects tighter price movement and falling volatility, typical of a stock getting ready for a breakout.
For more details on the technicals, see the full technical analysis report here.
Why This Mix Is Important
High-growth momentum strategies work best when strong fundamentals align with good technical entry points. Vertiv’s growing margins, consistent earnings beats, and upward revisions fit the "earnings momentum" part of CANSLIM, while its technical setup—marked by a bull flag and tight consolidation—provides a low-risk entry chance. The stock’s high relative performance further confirms its leading position, a core idea in Minervini’s approach.
Find More High-Growth Breakout Stocks
Vertiv is one example of a stock meeting these strict criteria. For investors looking for similar opportunities, check the High Growth Momentum Breakout Setups Screen, which filters for stocks with strong growth, technical ratings above 7, and high-quality setups.
Disclaimer: This article is not investment advice. Always do your own research or consult a financial advisor before making investment decisions.