
For technical investors, the search for promising opportunities often depends on finding stocks that are not only in a solid uptrend but are also ready for their next move higher. A frequent method looks for stocks with sound technical condition that are also making consolidation patterns, indicating a possible breakout is approaching. This method tries to capture the momentum of a trending stock as it leaves a period of rest, providing a more distinct entry point with set risk limits. One such method uses specialized scores to assess both the strength of a trend and the condition of a current price formation.
A recent scan using this method has identified Valero Energy Corp (NYSE:VLO) as a candidate deserving further examination. The integrated refining and renewable fuels company shows a notable technical view that matches the main ideas of a breakout-focused method.
A Base of Technical Condition
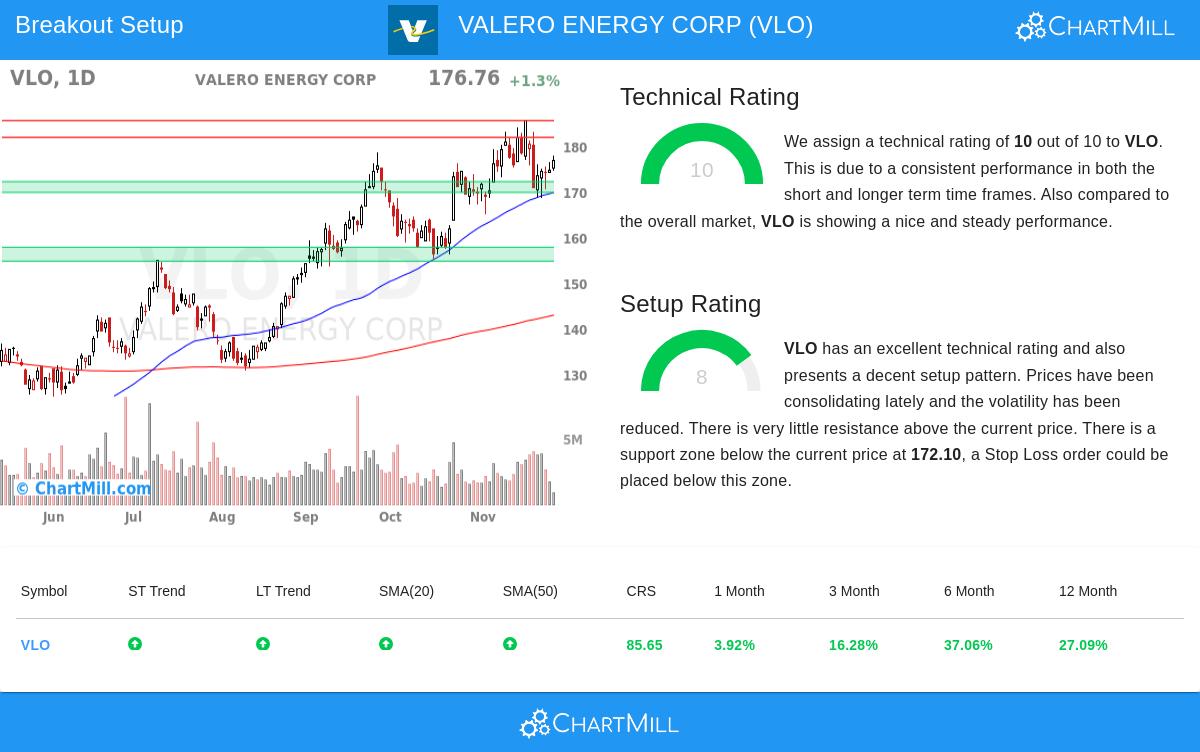
The main filter in a breakout scan looks for stocks showing solid and maintained upward momentum. This is important because it raises the chance that any breakout from consolidation will keep going in the current direction of the trend. Valero’s technical view is strong here, receiving a complete ChartMill Technical Rating of 10 out of 10. A close look at this score shows several areas of condition:
- Trend Agreement: Both the short-term and long-term trends for VLO are rated as positive. This agreement across time periods shows a unified and solid directional move, a good sign for trend followers.
- Market and Industry Position: The stock is doing better than 85% of all stocks in the market over the last year, with gains that have been steady. Inside its competitive Oil, Gas & Consumable Fuels industry, it does better than 83% of its 209 peers.
- Moving Average Condition: The stock is trading above all its main simple moving averages (20, 50, 100, and 200-day), and each of these averages is itself in a rising pattern. This layered agreement of moving averages is a typical sign of a sound uptrend, with each level acting as a possible support area on declines.
This sound technical base, as shown in the full technical report, indicates VLO is a market leader with momentum clearly in its favor. For the breakout method, this high rating speaks to the "which stock" question, sorting for issues with a good chance of continuing their rise.
A Sound Formation for Entry
While a solid trend is needed, it is not enough for a best entry. Buying a stock that has just completed a large, extended move often results in quick declines. The second important filter looks for a sound formation, a time of consolidation that gives a clear entry level and a sensible area to set a protective stop-loss order. Valero gets an 8 out of 10 on the ChartMill Setup Quality Rating, showing a positive pattern.
- Recent Consolidation: Over the last month, VLO has traded in a band between about $165 and $186. It is now trading in the middle of this band, where price action has been consolidating. This decrease in volatility and narrowing of the trading band often comes before a clear move.
- Set Support and Resistance: The analysis finds a nearby support area between $169.74 and $172.10, made by a mix of trend lines and moving averages. Just above the current price, resistance is seen near $181.77 and $185.44. This shape creates a clear structure: a breakout above resistance could mark a new upward stage, while a break of support would indicate the consolidation could become a larger correction.
- Practical Trade Limits: Based on this structure, the analysis proposes a possible breakout formation with an entry order just above the $181.77 resistance at $181.78. A stop-loss order could be set just below the main support area at $169.73, setting the risk on the trade at about 6.6%.
This formation quality directly speaks to the "when to buy" question for technical investors. The high rating verifies the stock is not overstretched but is instead moving within a band, giving a tactical entry point if it can gather the strength to move past overhead resistance.
Summary
Valero Energy Corp presents a case where solid basic trend mechanics meet a positive short-term price pattern. Its complete Technical Rating of 10 verifies its position as a market leader in a maintained uptrend, while its Setup Rating of 8 points out a current trading band that may be preparing for a continuation move. For investors using a technical breakout method, this mix is exactly what scans are made to find.
It is important to recall that technical formations show probability, not guarantee. Always do your own study, think about wider market conditions, now positive for the S&P 500, and be aware of company-specific events like earnings reports.
Interested in finding more possible breakout formations? You can run the same scanning method yourself using the Technical Breakout Setups screen to see a new list of qualifying stocks each day.
,
Disclaimer: This article is for informational purposes only and does not constitute investment advice, a recommendation, or an offer to buy or sell any security. The analysis is based on technical data and automated scoring models. You should conduct your own research and consult with a qualified financial advisor before making any investment decisions. Past performance is not indicative of future results.