
The CAN SLIM investment system, created by William O'Neil, is a mainstay of growth investing. It joins detailed fundamental study with important technical signs to find leading companies ready for major price gains. The method looks for stocks showing solid current and past earnings increases, new products or services, and strong institutional support, all while noting the need to purchase during clear market rises. A recent filter using these main ideas has identified Vista Energy SAB de CV (NYSE:VIST) as a possible choice for more study.
Fundamental Strength: The "CAN" in CAN SLIM
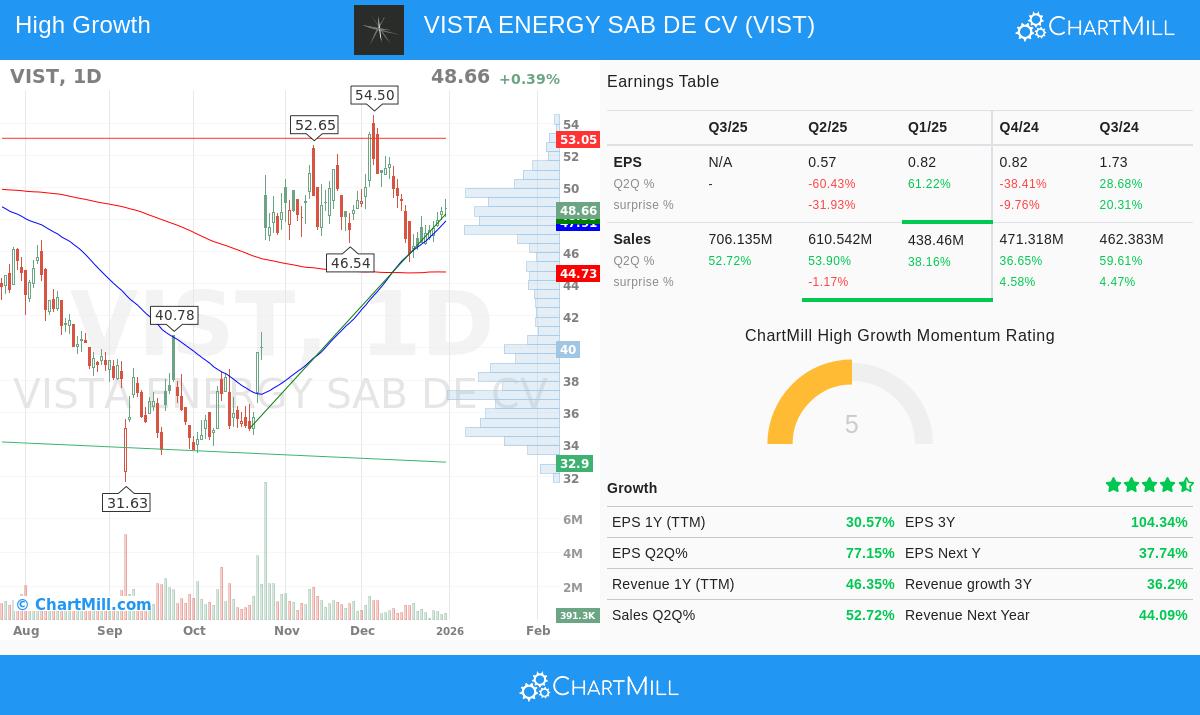
The base parts of the CAN SLIM system center on outstanding and speeding corporate earnings, which VIST seems to show. The "C" rule requires large or speeding quarterly earnings and sales increases.
- Quarterly Growth: VIST reported a year-over-year earnings per share (EPS) increase of 77.15% and a sales increase of 52.72% for its latest quarter, well above the system's usual lowest limit of 18-25%.
- Annual Earnings ("A"): The company's three-year EPS compound annual growth rate (CAGR) is a notable 104.34%, displaying the maintained, large growth that O'Neil looks for.
- Profitability & Efficiency: Backing this growth is a solid Return on Equity (ROE) of 30.36%, showing good use of shareholder money and easily exceeding the system's standard.
These numbers, covered in the full fundamental analysis report, describe a company in a powerful growth stage. The report gives VIST a fundamental score of 6 out of 10, noting its "excellent profitability" and "strong growth" while pointing out some issues with financial health, like its liquidity ratios.
Market Position and Technical Alignment
The last section of the CAN SLIM name deals with a stock's market action and support, key for timing purchases.
- Leadership ("L"): A main idea is to buy market leaders, not poor performers. VIST has a relative strength score of 82.09, meaning it has done better than about 82% of all stocks in the market over the last year. This fits well with the need to concentrate on the top level of the market.
- Institutional Sponsorship ("I"): While institutional ownership is now a small 12.82%, which is under the system's usual top limit to leave space for more buying, the important part is direction. The system prefers stocks that are being found or bought by institutional investors, which can be a major future driver.
- Supply & Demand ("S"): The company keeps a workable debt-to-equity ratio near 1.0, which is inside the filter's limits, and trades with good average daily volume, providing liquidity.
Technical Outlook and Market Context
The "M" in CAN SLIM means Market Direction, reminding investors that even the most powerful stocks can have difficulty in a falling overall market. At this time, both the short and long-term directions for the S&P 500 are up, giving a good setting for growth-focused plans.
VIST's technical analysis report gives a high score of 8 out of 10, stating that "both in the recent history as in the last year, VIST has proven to be a steady performer." The study confirms the stock is in a positive long-term direction and marks it as a leader in its industry group. Also, the report indicates a consolidation shape forming, which might give a planned entry point close to set support levels for investors who follow the system's rules on chart patterns and exact buying points.
A Choice for More Study
Based on the number-based filters taken from the CAN SLIM method, Vista Energy shows a strong profile. It displays the fast quarterly and annual earnings growth the system values, trades with market-leading relative strength, and shows a good technical position within a helpful wider market direction. The fundamental study suggests strong profitability and growth, though with comments on financial health that deserve investor notice.
For investors using this plan, VIST stands for a stock that has met a strict multi-factor filter. As usual, this should act as a beginning for more, personal careful study, including a look at the company's specific business drivers, industry forces, and risk points.
Interested in seeing other stocks that currently meet this CAN SLIM-based filter? You can find the complete, current list of results here.
Disclaimer: This article is for information only and does not make up financial advice, a suggestion, or an offer or request to buy or sell any securities. The study shown is based on data and filters at a specific time and may change. All investing has risk, including the chance of losing the original investment. Investors should do their own study and think about their personal money situation before making any investment choices.