
The Trade Desk Inc-Class A (NASDAQ:TTD) has become a strong option for growth investors, blending solid fundamental performance with a positive technical setup. The stock was found using a screening method that looks for high-growth stocks showing technical breakout patterns while keeping good profitability and financial stability. This method mixes fundamental and technical analysis to find companies with both strong business performance and short-term price movement, a mix that often leads to continued success.
Fundamental Strength: Growth and Profitability
The Trade Desk’s fundamental performance matches the traits of a high-growth stock, as seen in its fundamental analysis report:
-
Strong Growth Metrics:
- Revenue growth over the past year is 25.06%, while the 5-year average is 29.90%.
- Earnings Per Share (EPS) grew 34.37% YoY, with a 5-year average annual growth of 35%.
- Forward EPS growth is expected at 21.80%, showing continued progress.
-
High Profitability:
- The company has a Profit Margin of 16.04%, better than 91.75% of its peers in the Media industry.
- Return on Invested Capital (ROIC) of 10.81% is above its cost of capital, showing efficient use of resources.
-
Financial Health:
- With no debt and a strong Altman-Z score of 9.75, The Trade Desk shows stability, ranking higher than 92.78% of industry competitors.
These metrics highlight why growth investors may see TTD as appealing—its ability to grow revenue and earnings while staying profitable is a key trait of successful growth stocks, as covered in our introduction to growth investing.
Technical Breakout Potential
The stock’s technical analysis report shows a promising setup:
- Trend Strength: Both short-term and long-term trends are upward, with the stock above key moving averages (20-day, 50-day, and 100-day SMAs).
- Bull Flag Pattern: TTD is forming a bull flag—a pattern where a short pause follows a strong rise, often leading to further gains.
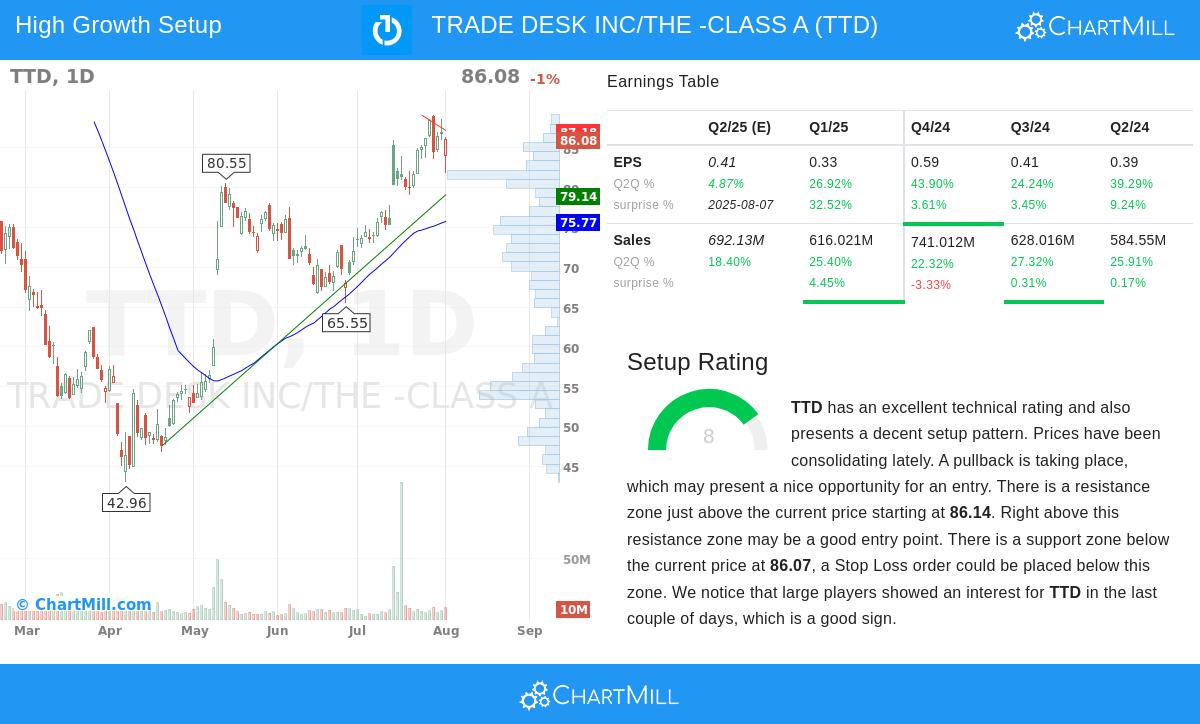
- Support and Resistance:
- Support levels are between $84.53,$86.07, based on moving averages and trendlines.
- A breakout above resistance at $86.14,$88.46 could point to more upside.
The stock’s relative strength is better than 85% of its industry peers, confirming its leading position.
Why This Combination Matters
The link between strong fundamentals and technical momentum is important:
- Growth stocks with high revenue/earnings growth often draw institutional interest, supporting long-term price growth.
- Breakout patterns show market confidence, suggesting fundamentals are being reflected in the price.
For investors, this means less dependence on speculative momentum—the technical breakout is backed by clear business performance.
Finding More Opportunities
The Trade Desk is a good example of the stocks this screen aims to find. For more ideas that fit this approach, check the full Strong Growth Stocks with Good Technical Setup Ratings screen.
Disclaimer: This analysis is not investment advice. Always do your own research or consult a financial advisor before making investment decisions.