
For investors using charts and price action to guide choices, a methodical way to find opportunities is important. One technique involves searching for stocks that show both solid technical condition and a consolidation pattern, indicating a possible breakout may be near. This approach centers on two specific metrics: the ChartMill Technical Rating, which judges the general condition and direction of a stock, and the ChartMill Setup Quality Rating, which measures how narrow and structured a stock’s recent price range has been. By merging these scores, traders try to find leading stocks that are resting before their next possible move up. A recent search using this technique has pointed to TJX COMPANIES INC (NYSE:TJX) as a notable candidate.
Technical Strength: A Base of Momentum
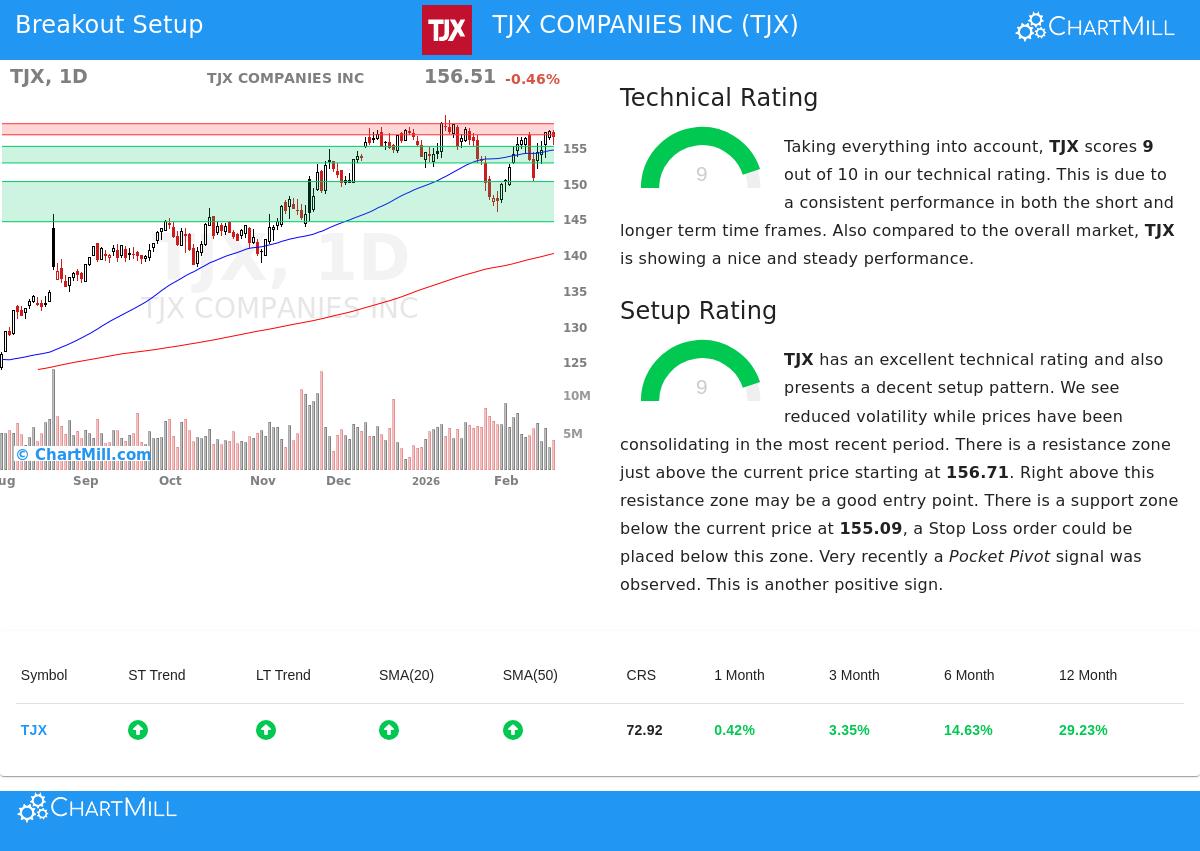
The first part of this breakout technique is finding stocks with good underlying technical condition, and TJX shows this well. According to the detailed technical report, the stock receives a near-perfect Technical Rating of 9 out of 10. This high number comes from several elements that point to continued upward momentum and relative performance.
- Trend Direction: Both the long-term and short-term trends for TJX are rated as positive. This agreement across time periods is a clear sign of a sound, trending stock and lessens the disagreement that can happen when trends show different directions.
- Market Performance: The stock is doing better than a large part of the wider market, with a relative strength percentile of 72.92. This means it has performed better than almost 73% of all stocks over the last year, a trait often looked for in market leaders.
- Support from Averages: The stock’s price is above all its important simple moving averages (20, 50, 100, and 200-day), and each of these averages is itself in a rising pattern. This layered, rising support formation is a solid bullish sign.
- Near Highs: TJX is now trading close to its 52-week high. While this by itself is not a signal to buy, when joined with good underlying technical condition, it shows the stock is in a strong uptrend rather than bouncing back from a decline.
This outstanding technical rating addresses the important question of which stock to examine. It sorts for equities already in clear uptrends, raising the chance that a breakout from consolidation will follow the existing direction of the trend.
Setup Quality: Finding the Entry Area
A solid trend is needed, but not enough, for a good trade. The second part of the technique is timing, which is where the Setup Quality Rating is important. TJX also gets a 9 in this group, showing it is forming a good consolidation pattern. This deals with the question of when to think about an entry.
- Consolidation and Lower Volatility: The technical report states the stock has been trading in a set range over the last month and that price movement has lessened. This price coiling behavior, where the range narrows, often comes before a clear move.
- Clear Support and Resistance: The analysis finds a well-marked support area between $152.77 and $155.09, made from a mix of trendlines and moving averages. Just above the current price, a resistance area is between $156.71 and $158.26. These clear levels give logical points for a stop-loss (below support) and a possible breakout trigger (above resistance).
- Supportive Volume Behavior: Very recently, the stock showed a "Pocket Pivot" signal, which is a price increase on volume greater than the highest down volume seen in the previous ten days. This can be an early indicator of institutional buying during a consolidation period.
The high setup number indicates the stock is not stretched but is instead gathering force inside a narrow range. For a technical trader, this creates a situation with a measurable risk: a long position could be started on a breakout above the resistance area, with a protective stop placed below the nearby support area.
A Possible Technical Plan
Based on this analysis, the technical report describes a sample trading plan. It proposes an entry point at $158.27, which is just above the noted resistance area, and an initial stop-loss at $152.76, placed below the main support area. This sets a risk of about 3.5% on the trade. It is important to know this is an automated, explanatory example of how the levels could be used. Any trading choice must come from an individual’s own study, risk comfort, and verification of the real price action.
The mix of a top Technical Rating and a high Setup Quality Rating makes TJX an interesting chart for investors using this breakout method. It shows a leading stock that is pausing inside a strong uptrend, possibly preparing for its next rise.
Looking for more ideas like this? Our daily Technical Breakout Setups screen regularly searches the market for stocks displaying solid technical condition and good consolidation patterns.
,
Disclaimer: This article is for information only and does not form investment advice, a suggestion, or an offer to buy or sell any security. The analysis and any sample trade plan are based on technical indicators and past data, which are not assurances of future results. Investing carries risk, including the possible loss of principal. Always do your own research and think about talking with a qualified financial advisor before making any investment choices.