
Technical breakout strategies aim to identify stocks that are both technically strong and forming consolidation patterns, suggesting a potential upward price movement. This approach combines two key metrics: a high technical rating, which confirms the stock is in a established uptrend, and a high setup quality rating, which indicates the stock is consolidating within a tight range and may be poised for a breakout. By focusing on securities that perform well in both areas, investors seek to enter positions as momentum resumes following a period of stability. TJX COMPANIES INC (NYSE:TJX) recently appeared on such a scan, demonstrating notable characteristics for this strategy.
Technical Strength Assessment
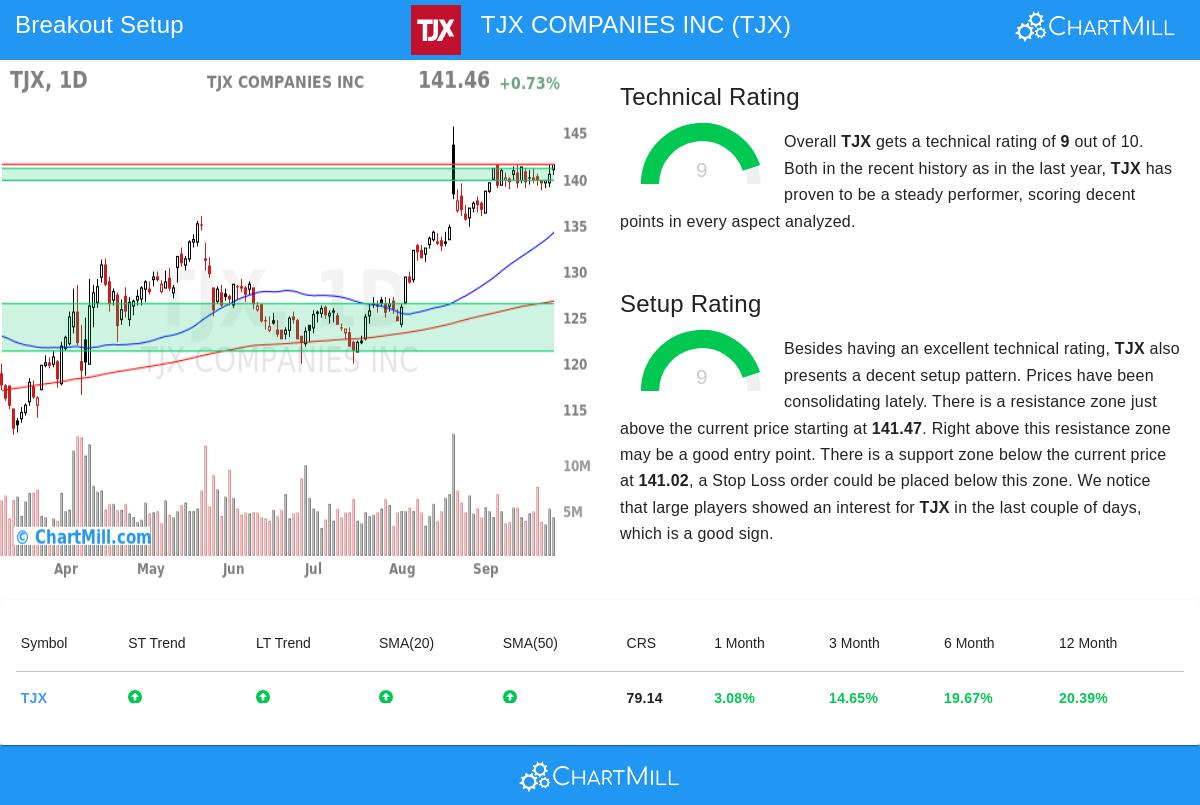
A foundational element of the breakout strategy is investing in stocks with solid and sustained upward momentum. TJX exhibits very good technical health, earning a top-tier Technical Rating of 9 out of 10. This score reflects strong performance across multiple timeframes and technical indicators. The strength is broad-based, as evidenced by several key metrics.
- Trend Consistency: Both the long-term and short-term trends for TJX are positive, indicating aligned bullish momentum.
- Moving Average Alignment: The stock is trading above all its key moving averages (20-day, 50-day, 100-day, and 200-day), and each average is itself in an upward slope, confirming the trend's strength.
- Relative Strength: TJX has outperformed 79% of all stocks over the past year and ranks in the top tier of its Specialty Retail industry, demonstrating it is a market leader.
This strong technical backdrop is crucial because it increases the probability that a breakout from a consolidation pattern will lead to a continued advance rather than a false signal. A detailed breakdown of these factors is available in the full technical report.
Setup Quality and Consolidation Pattern
While technical strength identifies a promising candidate, the setup quality pinpoints a potential entry opportunity. TJX also scores a 9 out of 10 for Setup Quality, indicating it is in a pronounced consolidation phase. After a significant run-up, the stock's price action has tightened, trading in a narrow range between $135.90 and $141.57 over the past month. This period of stability is a positive sign, as it allows the stock to absorb its previous gains and build a new base of support before its next potential move.
The consolidation has defined clear support and resistance levels, which are essential for managing risk. The analysis identifies a strong support zone just below the current price, ranging from $139.73 to $141.02, formed by a combination of trendlines and moving averages. Immediately overhead is a defined resistance level at $141.47. A decisive break above this resistance could signal the start of a new leg up. Furthermore, there are indications that large institutional players have shown interest in TJX recently, adding credibility to the setup.
Trading Implications and Market Context
The combination of a strong technical rating and a high-quality setup presents a clear scenario for technical investors. The strategy suggests a potential entry point on a breakout above the $141.47 resistance level, with a stop-loss order placed below the identified support zone to manage downside risk. This structure provides a disciplined framework for a trade with a favorable risk-reward profile. It is worth noting that the broader market environment is supportive, with the S&P 500 exhibiting positive trends in both the short and long term, which can provide tailwinds for individual breakouts.
The current technical picture for TJX demonstrates how a leading stock can pause to consolidate its gains, offering a potential entry point for investors who missed the initial move. The high ratings across both technical health and setup quality make it a standout candidate worthy of further analysis for those employing a breakout methodology.
For investors interested in discovering other stocks currently presenting similar technical breakout patterns, new results are generated daily. You can explore the most current opportunities by visiting the Technical Breakout Setups screen.
Disclaimer: This article is for informational purposes only and does not constitute investment advice or a recommendation to buy or sell any security. All trading and investment activities involve risk, and individuals should conduct their own research or consult with a qualified financial advisor before making any decisions.