
Our stock screener has spotted THOR INDUSTRIES INC (NYSE:THO) as a good dividend stock with solid fundamentals. THO shows decent health and profitability. At the same time it gives a good and sustainable dividend. We'll dive into each aspect below.
Unpacking THO's Dividend Rating
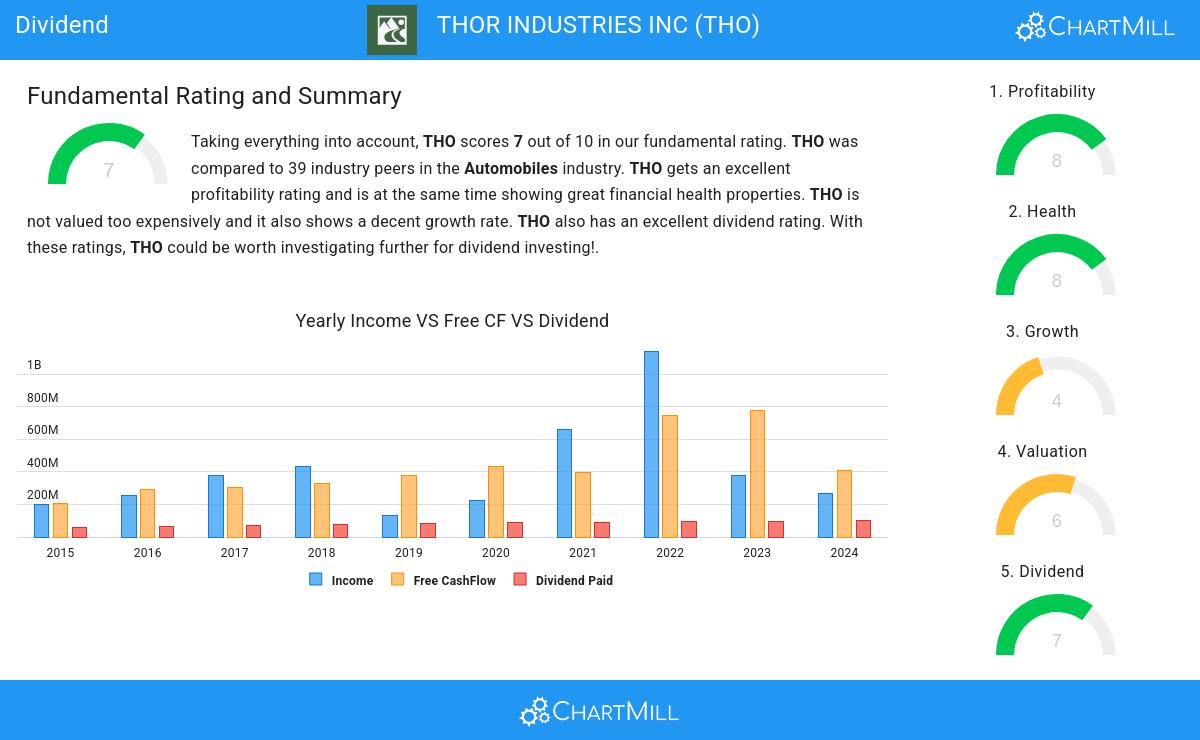
ChartMill assigns a proprietary Dividend Rating to each stock. The score is computed by evaluating various valuation aspects, like the yield, the history, the dividend growth and sustainability. THO was assigned a score of 7 for dividend:
- THO's Dividend Yield is rather good when compared to the industry average which is at 3.77. THO pays more dividend than 84.62% of the companies in the same industry.
- THO has been paying a dividend for at least 10 years, so it has a reliable track record.
- THO has not decreased its dividend for at least 10 years, so it has a reliable track record of non decreasing dividend.
- THO's earnings are growing more than its dividend. This makes the dividend growth sustainable.
What does the Health looks like for THO
ChartMill assigns a proprietary Health Rating to each stock. The score is computed by evaluating various liquidity and solvency ratios and ranges from 0 to 10. THO was assigned a score of 8 for health:
- THO has an Altman-Z score of 3.51. This indicates that THO is financially healthy and has little risk of bankruptcy at the moment.
- THO's Altman-Z score of 3.51 is amongst the best of the industry. THO outperforms 92.31% of its industry peers.
- The Debt to FCF ratio of THO is 2.03, which is a good value as it means it would take THO, 2.03 years of fcf income to pay off all of its debts.
- THO has a better Debt to FCF ratio (2.03) than 94.87% of its industry peers.
- A Debt/Equity ratio of 0.27 indicates that THO is not too dependend on debt financing.
- With a decent Debt to Equity ratio value of 0.27, THO is doing good in the industry, outperforming 74.36% of the companies in the same industry.
- THO has a better Current ratio (1.71) than 71.79% of its industry peers.
- The current and quick ratio evaluation for THO is rather negative, while it does have excellent solvency and profitability. These ratios do not necessarly indicate liquidity issues and need to be evaluated against the specifics of the business.
Analyzing Profitability Metrics
Discover ChartMill's exclusive Profitability Rating, a proprietary metric that assesses stocks on a scale of 0 to 10. It takes into consideration various profitability ratios and margins, both in absolute terms and relative to industry peers. Notably, THO has achieved a 8:
- THO has a Return On Assets of 3.01%. This is amongst the best in the industry. THO outperforms 82.05% of its industry peers.
- Looking at the Return On Equity, with a value of 5.12%, THO is in the better half of the industry, outperforming 71.79% of the companies in the same industry.
- Looking at the Return On Invested Capital, with a value of 4.82%, THO is in the better half of the industry, outperforming 79.49% of the companies in the same industry.
- Measured over the past 3 years, the Average Return On Invested Capital for THO is above the industry average of 6.75%.
- The last Return On Invested Capital (4.82%) for THO is well below the 3 year average (11.53%), which needs to be investigated, but indicates that THO had better years and this may not be a problem.
- With a decent Profit Margin value of 2.13%, THO is doing good in the industry, outperforming 71.79% of the companies in the same industry.
- In the last couple of years the Profit Margin of THO has grown nicely.
- The Operating Margin of THO (3.56%) is better than 76.92% of its industry peers.
- THO has a Gross Margin of 14.21%. This is in the better half of the industry: THO outperforms 61.54% of its industry peers.
- In the last couple of years the Gross Margin of THO has grown nicely.
More Best Dividend stocks can be found in our Best Dividend screener.
For an up to date full fundamental analysis you can check the fundamental report of THO
Disclaimer
This article should in no way be interpreted as advice. The article is based on the observed metrics at the time of writing, but you should always make your own analysis and trade or invest at your own responsibility.