
Take a closer look at TELEFLEX INC (NYSE:TFX), a remarkable value stock uncovered by our stock screener. TFX excels in fundamentals and maintains a very reasonable valuation. Let's break it down further.
A Closer Look at Valuation for TFX
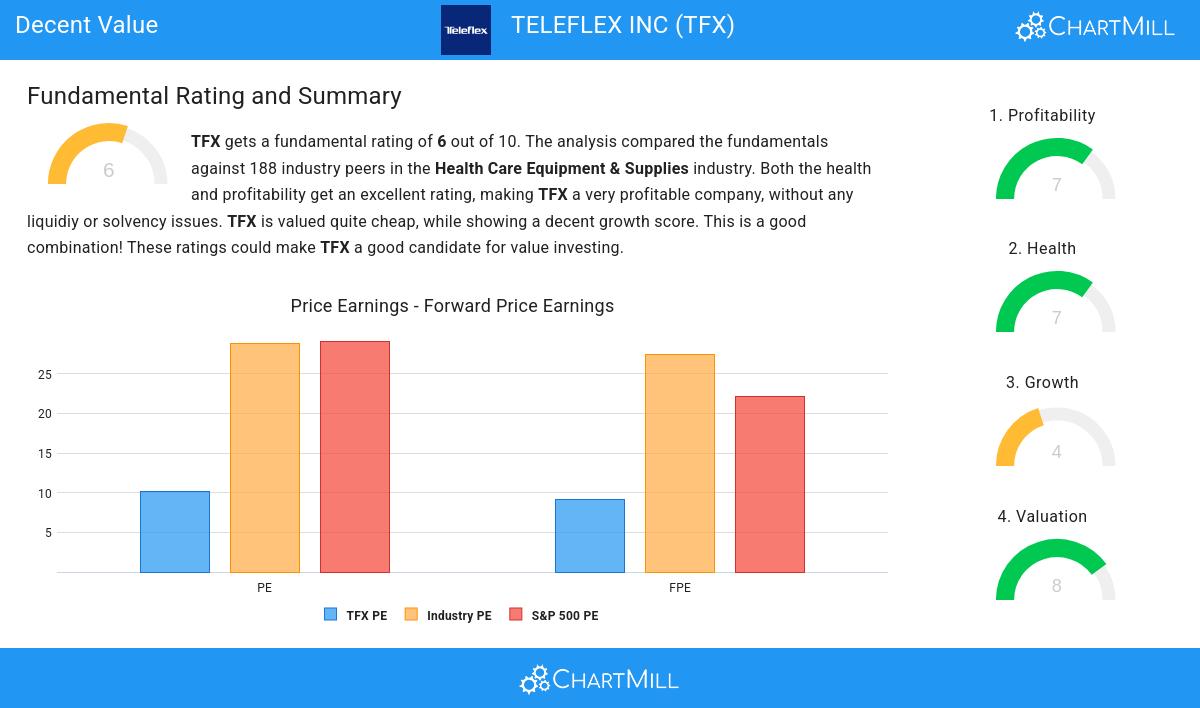
ChartMill assigns a Valuation Rating to every stock. This score ranges from 0 to 10 and evaluates the different valuation aspects and compares the price to earnings and cash flows, while taking into account profitability and growth. TFX scores a 8 out of 10:
- Based on the Price/Earnings ratio of 10.10, the valuation of TFX can be described as reasonable.
- Compared to the rest of the industry, the Price/Earnings ratio of TFX indicates a rather cheap valuation: TFX is cheaper than 96.81% of the companies listed in the same industry.
- Compared to an average S&P500 Price/Earnings ratio of 29.14, TFX is valued rather cheaply.
- With a Price/Forward Earnings ratio of 9.20, the valuation of TFX can be described as very reasonable.
- TFX's Price/Forward Earnings ratio is rather cheap when compared to the industry. TFX is cheaper than 96.28% of the companies in the same industry.
- Compared to an average S&P500 Price/Forward Earnings ratio of 22.10, TFX is valued rather cheaply.
- Based on the Enterprise Value to EBITDA ratio, TFX is valued cheaper than 92.55% of the companies in the same industry.
- 92.55% of the companies in the same industry are more expensive than TFX, based on the Price/Free Cash Flow ratio.
- TFX has a very decent profitability rating, which may justify a higher PE ratio.
Profitability Assessment of TFX
ChartMill assigns a Profitability Rating to every stock. This score ranges from 0 to 10 and evaluates the different profitability ratios and margins, both absolutely, but also relative to the industry peers. TFX scores a 7 out of 10:
- The Return On Assets of TFX (0.98%) is better than 73.94% of its industry peers.
- TFX has a better Return On Equity (1.63%) than 75.00% of its industry peers.
- TFX has a Return On Invested Capital of 7.42%. This is amongst the best in the industry. TFX outperforms 83.51% of its industry peers.
- The last Return On Invested Capital (7.42%) for TFX is above the 3 year average (7.21%), which is a sign of increasing profitability.
- The Profit Margin of TFX (2.29%) is better than 75.00% of its industry peers.
- The Operating Margin of TFX (17.91%) is better than 89.89% of its industry peers.
Health Assessment of TFX
ChartMill utilizes a Health Rating to assess stocks, scoring them on a scale of 0 to 10. This rating takes into account a variety of liquidity and solvency ratios, both in absolute terms and in comparison to industry peers. TFX has earned a 7 out of 10:
- An Altman-Z score of 3.03 indicates that TFX is not in any danger for bankruptcy at the moment.
- TFX's Altman-Z score of 3.03 is fine compared to the rest of the industry. TFX outperforms 67.55% of its industry peers.
- TFX has a debt to FCF ratio of 3.25. This is a good value and a sign of high solvency as TFX would need 3.25 years to pay back of all of its debts.
- The Debt to FCF ratio of TFX (3.25) is better than 86.17% of its industry peers.
- A Debt/Equity ratio of 0.36 indicates that TFX is not too dependend on debt financing.
- TFX has a Current Ratio of 2.27. This indicates that TFX is financially healthy and has no problem in meeting its short term obligations.
Understanding TFX's Growth
ChartMill assigns a Growth Rating to every stock. This score ranges from 0 to 10 and evaluates the different growth aspects like EPS and Revenue, both in the past as in the future. TFX scores a 4 out of 10:
- The EPS growth rate is accelerating: in the next years the growth will be better than in the last years.
Our Decent Value screener lists more Decent Value stocks and is updated daily.
For an up to date full fundamental analysis you can check the fundamental report of TFX
Keep in mind
This article should in no way be interpreted as advice. The article is based on the observed metrics at the time of writing, but you should always make your own analysis and trade or invest at your own responsibility.