
Our stock screening tool has identified TIDEWATER INC (NYSE:TDW) as an undervalued gem with strong fundamentals. TDW boasts decent financial health and profitability while maintaining an attractive price point. We'll break it down further.
A Closer Look at Valuation for TDW
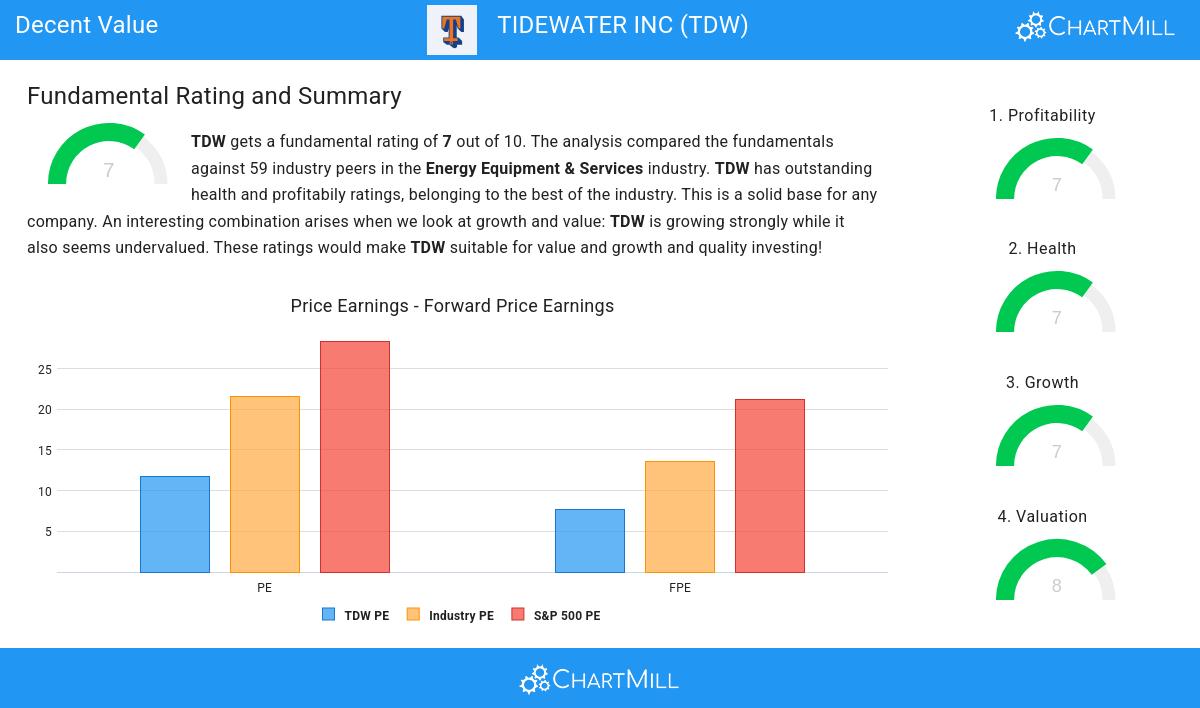
ChartMill assigns a Valuation Rating to every stock. This score ranges from 0 to 10 and evaluates the different valuation aspects and compares the price to earnings and cash flows, while taking into account profitability and growth. TDW scores a 8 out of 10:
- TDW is valuated reasonably with a Price/Earnings ratio of 11.74.
- Compared to the rest of the industry, the Price/Earnings ratio of TDW indicates a somewhat cheap valuation: TDW is cheaper than 67.80% of the companies listed in the same industry.
- Compared to an average S&P500 Price/Earnings ratio of 28.38, TDW is valued rather cheaply.
- TDW is valuated cheaply with a Price/Forward Earnings ratio of 7.62.
- Compared to the rest of the industry, the Price/Forward Earnings ratio of TDW indicates a rather cheap valuation: TDW is cheaper than 93.22% of the companies listed in the same industry.
- TDW's Price/Forward Earnings ratio indicates a rather cheap valuation when compared to the S&P500 average which is at 21.15.
- Based on the Price/Free Cash Flow ratio, TDW is valued a bit cheaper than 77.97% of the companies in the same industry.
- TDW's low PEG Ratio(NY), which compensates the Price/Earnings for growth, indicates a rather cheap valuation of the company.
- TDW has a very decent profitability rating, which may justify a higher PE ratio.
- A more expensive valuation may be justified as TDW's earnings are expected to grow with 64.45% in the coming years.
Profitability Analysis for TDW
ChartMill employs its own Profitability Rating system for stock evaluation. This score, ranging from 0 to 10, is derived from an analysis of diverse profitability metrics and margins. In the case of TDW, the assigned 7 is noteworthy for profitability:
- TDW has a better Return On Assets (8.71%) than 79.66% of its industry peers.
- TDW's Return On Equity of 16.22% is fine compared to the rest of the industry. TDW outperforms 77.97% of its industry peers.
- The Return On Invested Capital of TDW (12.46%) is better than 88.14% of its industry peers.
- The 3 year average ROIC (7.28%) for TDW is below the current ROIC(12.46%), indicating increased profibility in the last year.
- TDW has a Profit Margin of 13.42%. This is amongst the best in the industry. TDW outperforms 81.36% of its industry peers.
- Looking at the Operating Margin, with a value of 21.96%, TDW belongs to the top of the industry, outperforming 84.75% of the companies in the same industry.
- Looking at the Gross Margin, with a value of 48.24%, TDW belongs to the top of the industry, outperforming 88.14% of the companies in the same industry.
- In the last couple of years the Gross Margin of TDW has grown nicely.
How We Gauge Health for TDW
A critical element of ChartMill's stock evaluation is the Health Rating, which spans from 0 to 10. This rating considers multiple health factors, including liquidity and solvency, both in absolute terms and relative to industry peers. TDW has received a 7 out of 10:
- TDW's Altman-Z score of 2.24 is fine compared to the rest of the industry. TDW outperforms 67.80% of its industry peers.
- TDW has a debt to FCF ratio of 2.59. This is a good value and a sign of high solvency as TDW would need 2.59 years to pay back of all of its debts.
- TDW has a Debt to FCF ratio of 2.59. This is in the better half of the industry: TDW outperforms 64.41% of its industry peers.
- TDW has a Current Ratio of 2.11. This indicates that TDW is financially healthy and has no problem in meeting its short term obligations.
- TDW's Current ratio of 2.11 is fine compared to the rest of the industry. TDW outperforms 62.71% of its industry peers.
- A Quick Ratio of 2.00 indicates that TDW has no problem at all paying its short term obligations.
- TDW's Quick ratio of 2.00 is fine compared to the rest of the industry. TDW outperforms 74.58% of its industry peers.
Evaluating Growth: TDW
ChartMill employs its own Growth Rating system for all stocks. This score, ranging from 0 to 10, is derived by evaluating different growth factors, such as EPS and revenue growth, taking into account both past performance and future projections. TDW has earned a 7 for growth:
- The Earnings Per Share has grown by an impressive 83.78% over the past year.
- The Revenue has grown by 33.25% in the past year. This is a very strong growth!
- TDW shows a strong growth in Revenue. Measured over the last years, the Revenue has been growing by 22.57% yearly.
- Based on estimates for the next years, TDW will show a very strong growth in Earnings Per Share. The EPS will grow by 64.45% on average per year.
- Based on estimates for the next years, TDW will show a quite strong growth in Revenue. The Revenue will grow by 9.11% on average per year.
More Decent Value stocks can be found in our Decent Value screener.
Check the latest full fundamental report of TDW for a complete fundamental analysis.
Disclaimer
This article should in no way be interpreted as advice. The article is based on the observed metrics at the time of writing, but you should always make your own analysis and trade or invest at your own responsibility.