
For growth-minded investors, high revenue and EPS growth are key criteria. Today, we'll examine whether TRIP.COM GROUP LTD-ADR (NASDAQ:TCOM) fits the bill for growth investing, particularly as it forms a base and hints at a potential breakout. Remember, due diligence is essential, but TRIP.COM GROUP LTD-ADR has caught our attention on our screen for growth with base formation. It may warrant additional investigation.
Growth Assessment of TCOM
To evaluate a stock's growth potential, ChartMill utilizes a Growth Rating on a scale of 0 to 10. This comprehensive assessment considers various growth aspects, including historical and estimated EPS and revenue growth. TCOM has achieved a 8 out of 10:
- The Earnings Per Share has grown by an impressive 44.94% over the past year.
- Measured over the past years, TCOM shows a very strong growth in Earnings Per Share. The EPS has been growing by 21.52% on average per year.
- TCOM shows quite a strong growth in Revenue. In the last year, the Revenue has grown by 19.73%.
- TCOM shows quite a strong growth in Revenue. Measured over the last years, the Revenue has been growing by 8.36% yearly.
- Based on estimates for the next years, TCOM will show a quite strong growth in Earnings Per Share. The EPS will grow by 15.40% on average per year.
- TCOM is expected to show quite a strong growth in Revenue. In the coming years, the Revenue will grow by 12.41% yearly.
- The Revenue growth rate is accelerating: in the next years the growth will be better than in the last years.
Evaluating Health: TCOM
ChartMill assigns a proprietary Health Rating to each stock. The score is computed by evaluating various liquidity and solvency ratios and ranges from 0 to 10. TCOM was assigned a score of 6 for health:
- TCOM has a better Altman-Z score (2.55) than 75.00% of its industry peers.
- The Debt to FCF ratio of TCOM is 2.08, which is a good value as it means it would take TCOM, 2.08 years of fcf income to pay off all of its debts.
- TCOM's Debt to FCF ratio of 2.08 is amongst the best of the industry. TCOM outperforms 86.03% of its industry peers.
- TCOM has a Debt/Equity ratio of 0.24. This is a healthy value indicating a solid balance between debt and equity.
- Looking at the Debt to Equity ratio, with a value of 0.24, TCOM is in the better half of the industry, outperforming 77.94% of the companies in the same industry.
- Looking at the Current ratio, with a value of 1.51, TCOM is in the better half of the industry, outperforming 72.06% of the companies in the same industry.
- TCOM has a better Quick ratio (1.51) than 75.00% of its industry peers.
Exploring TCOM's Profitability
ChartMill employs its own Profitability Rating system for stock evaluation. This score, ranging from 0 to 10, is derived from an analysis of diverse profitability metrics and margins. In the case of TCOM, the assigned 7 is noteworthy for profitability:
- With a decent Return On Assets value of 7.04%, TCOM is doing good in the industry, outperforming 77.21% of the companies in the same industry.
- TCOM has a better Return On Equity (11.97%) than 72.06% of its industry peers.
- The last Return On Invested Capital (6.54%) for TCOM is above the 3 year average (4.09%), which is a sign of increasing profitability.
- TCOM's Profit Margin of 32.03% is amongst the best of the industry. TCOM outperforms 100.00% of its industry peers.
- In the last couple of years the Profit Margin of TCOM has grown nicely.
- TCOM's Operating Margin of 26.60% is amongst the best of the industry. TCOM outperforms 91.91% of its industry peers.
- TCOM's Operating Margin has improved in the last couple of years.
- Looking at the Gross Margin, with a value of 81.25%, TCOM belongs to the top of the industry, outperforming 96.32% of the companies in the same industry.
Looking at the Setup
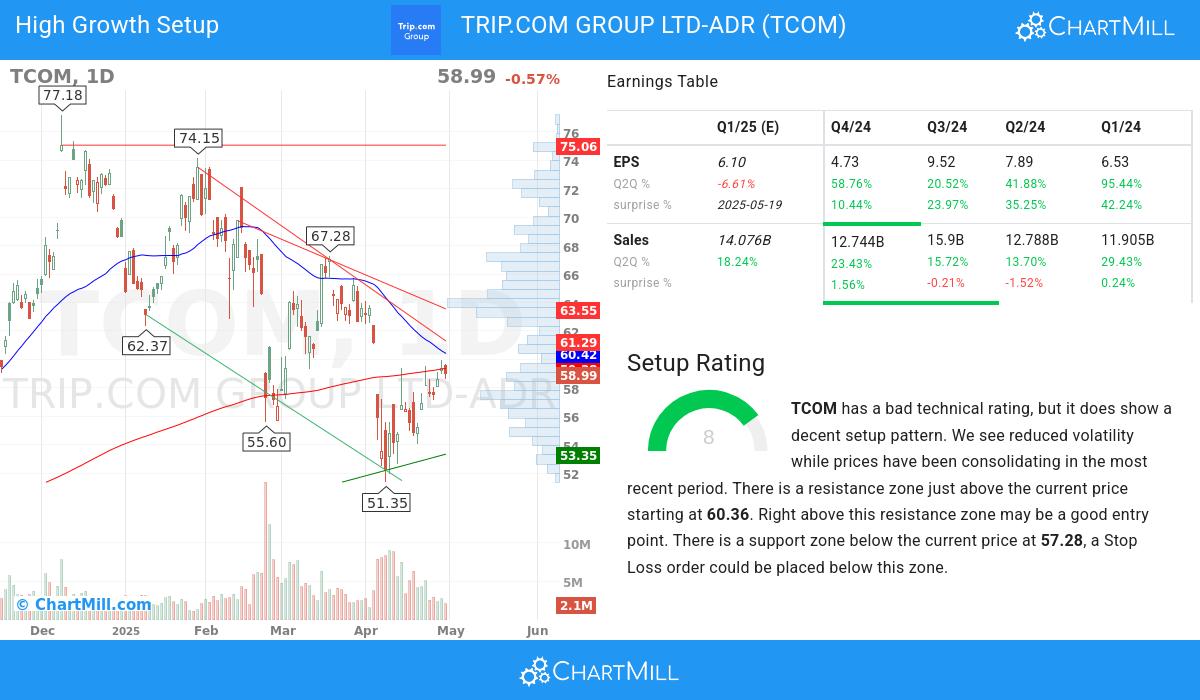
ChartMill also assigns a Setup Rating to each stock. This rating, on a scale of 0 to 10, reflects the degree of consolidation observed based on short-term technical indicators. Currently, TCOM exhibits a 8 setup rating, indicating its consolidation status in recent days and weeks.
TCOM has a bad technical rating, but it does show a decent setup pattern. Prices have been consolidating lately and the volatility has been reduced. There is a resistance zone just above the current price starting at 60.36. Right above this resistance zone may be a good entry point. There is a support zone below the current price at 57.28, a Stop Loss order could be placed below this zone.
More Strong Growth stocks can be found in our Strong Growth screener.
For an up to date full fundamental analysis you can check the fundamental report of TCOM
Our latest full technical report of TCOM contains the most current technical analsysis.
Disclaimer
This is not investing advice! The article highlights some of the observations at the time of writing, but you should always make your own analysis and invest based on your own insights.