
In the search for long-term investment opportunities, many investors turn to the principles laid out by legendary fund manager Peter Lynch. His strategy, detailed in One Up on Wall Street, focuses on finding companies with strong, lasting growth that are trading at sensible prices, a philosophy often called Growth at a Reasonable Price (GARP). Lynch supported a disciplined, fundamental method, searching for firms with good earnings expansion, sound financials, and prices that do not overpay for future potential. A stock screener using his standards can help find such companies, sorting for specific measures related to profit, debt, cash availability, and price.
One name that recently appeared from such a search is TRIP.COM GROUP LTD-ADR (NASDAQ:TCOM). As a top global one-stop travel platform, the company runs popular brands like Ctrip, Qunar, Trip.com, and Skyscanner, connecting travelers with a full set of booking services. For investors using a Lynch-style view, TCOM presents an interesting case for more study.
Fit with Lynch's Growth and Price Filters
Peter Lynch stressed lasting growth, cautioning against companies growing too fast to keep up. He also highlighted the significance of price, choosing to pay a sensible amount for that growth. The search based on his plan uses several important filters, and TCOM's current position matches them closely.
- Lasting Earnings Growth: Lynch wanted a 5-year earnings per share (EPS) growth rate between 15% and 30%. TCOM's EPS has increased at an average yearly rate of 21.05% over the past five years. This puts it inside Lynch's preferred "lasting" range, showing solid expansion without entering the possibly unstable high-growth area he sidestepped.
- Appealing Price via PEG Ratio: Maybe the central part of Lynch's price method is the Price/Earnings to Growth (PEG) ratio, which tries to find stocks that could be priced low compared to their growth path. He preferred a PEG ratio of 1 or less. TCOM stands out here, with a PEG ratio based on past 5-year growth at 0.37. This low number hints the market may not be completely valuing the company's past earnings growth, a key sign for price-aware growth investors.
- High Profitability (ROE): Lynch asked for a high return on equity (ROE) as a mark of an efficient and profitable business. The search sets a minimum of 15%. TCOM's ROE of 18.53% not only meets this level but also does better than a large part of its industry competitors, showing good use of shareholder money.
- Cautious Financial Health: To limit high risk, Lynch liked companies with firm balance sheets. The search filters for a Debt/Equity ratio below 0.6 and a Current Ratio of at least 1.
- TCOM's Debt/Equity ratio is a very low 0.07, showing little use of debt funding and beating even Lynch's stricter personal choice for a ratio below 0.25.
- Its Current Ratio of 1.48 indicates enough cash availability to cover near-term debts, giving a safety buffer.
A Top-Level Fundamental Summary
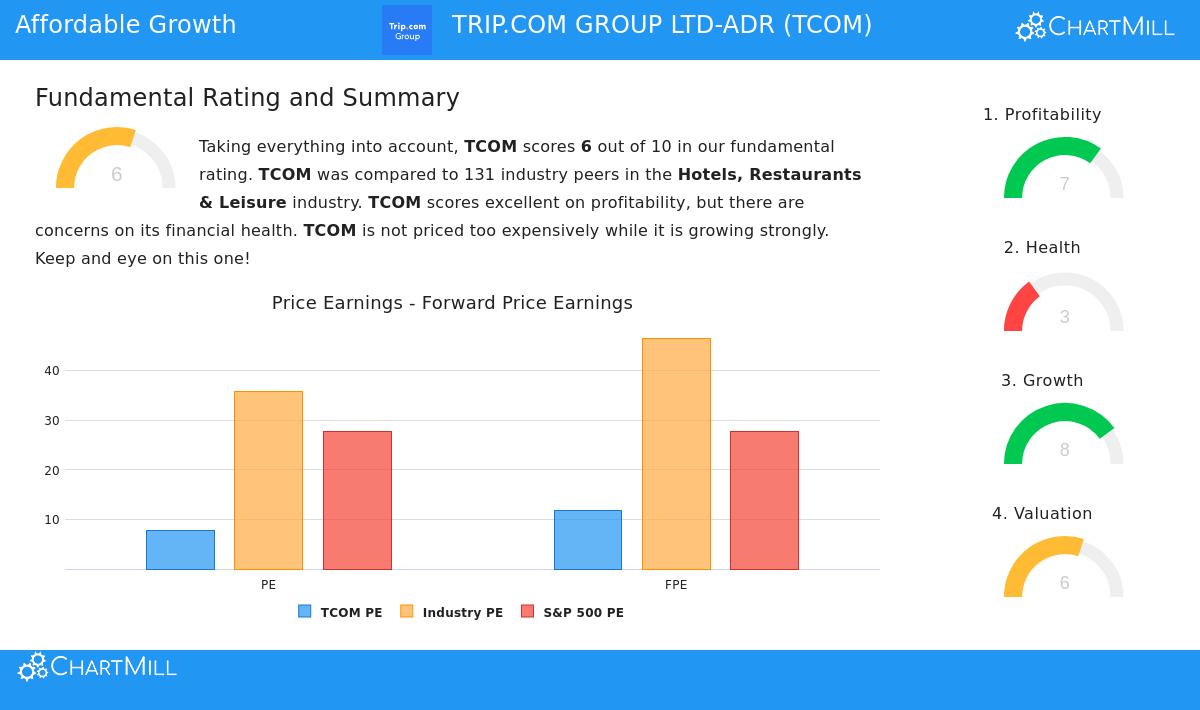
A wider fundamental study of TCOM supports several of the points shown by the Lynch search while giving a fuller picture. According to a detailed fundamental report, the company gets an overall score of 6 out of 10, pointing to a mixed but hopeful profile.
- Profitability is a Clear Plus: The company scores well here (7 out of 10), having very good profit margins that place near the best in its industry. Both its operating and net margins have shown upward movement.
- Growth Path Stays Positive: With a growth score of 8 out of 10, TCOM shows strong past results in both sales and EPS. Significantly, experts expect this growth to keep going at a good speed in the next few years.
- Price Seems Sensible: The price score of 6 out of 10 is neutral, but the basic measures tell a more positive story. The company's P/E and Forward P/E ratios are viewed as low compared to both the wider S&P 500 and its industry competitors, backing the appealing PEG ratio finding.
- Financial Health Shows Some Issues: This is the area with the lowest score (3 out of 10). While the low debt level is a big positive, the report notes issues like a recent rise in shares available and a Return on Invested Capital (ROIC) that, while getting better, has in the past been below the cost of capital.
Investment Points for the Long Term
For an investor with a long-term, GARP-focused view, TCOM presents a noteworthy idea. It works in the large and steady travel sector, a "simple" but needed industry Lynch might like. The company's main measures fit well with a plan seeking lasting growth at a sensible price, as shown by its solid EPS growth, high ROE, low debt, and interesting PEG ratio.
However, the Lynch thinking needs looking past the search results. The issues noted in the fundamental health study, especially about capital efficiency and share increase, deserve more checking. An investor's "own work" would include judging the strength of Trip.com's competitive position in the global online travel field, the possible effect of economic changes on travel needs, and the company's aims to better its return on invested capital.
Finding More Possibilities
The Peter Lynch plan is made to create a short list of options for more detailed study. TCOM is one example that passed the first filters. Investors curious about finding other companies that currently meet these disciplined growth and price standards can use the live Peter Lynch search themselves.
Disclaimer: This article is for information only and does not form financial guidance, a suggestion, or an offer to buy or sell any security. Investing holds risk, including the possible loss of original money. You should do your own complete study and think about talking with a qualified financial advisor before making any investment choices.