
For investors using a technical breakout strategy, the goal is to find stocks that are technically sound and ready for their next move higher. This method often uses filters for equities with a high technical rating, showing a solid and confirmed uptrend, and a high setup quality rating, which means the stock is trading in a narrow range and could be getting ready for a breakout. Using these two measures together, traders try to join a strong trend at a good time, just as it gains speed again.
SUNCOR ENERGY INC (NYSE:SU) now shows a profile that fits this method well. The integrated Canadian energy company has recently been listed on technical breakout scans, attracting notice for its interesting chart formation.
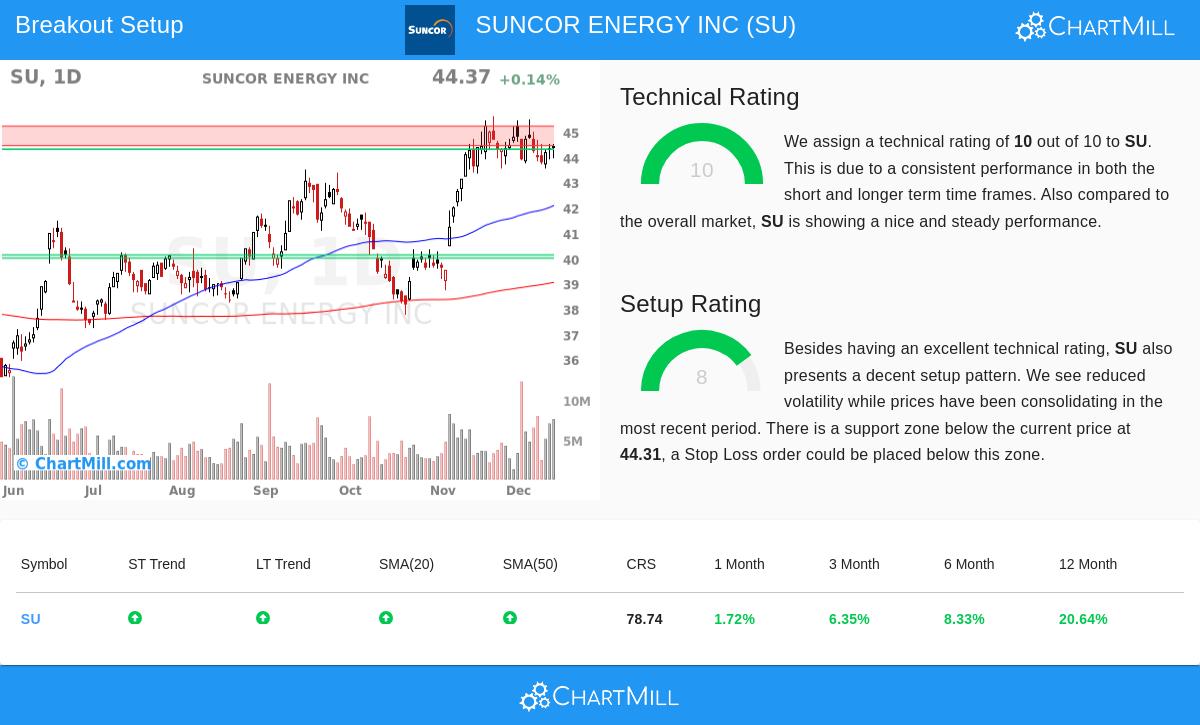
Technical Strength: A Base of Momentum
The base of a breakout strategy is a stock's fundamental technical condition, and Suncor does very well here. Based on its ChartMill Technical Analysis report, the stock gets a complete technical rating of 10 out of 10. This high score shows good readings across different time periods and indicators, which is important for the strategy as it aims to use existing momentum instead of guessing a turn.
Main points adding to this rating are:
- Positive Trends: Both the long-term and short-term trends are clearly positive, giving a good setting for more upward price action.
- Good Relative Performance: The stock's performance over one year is better than 78% of the market and it is ranked above 74% of similar companies in the Oil, Gas & Consumable Fuels industry.
- Price Level: SU is trading close to its 52-week high, a common trait of leading stocks preferred by momentum investors.
- Supportive Moving Averages: The stock's price is higher than all its main simple moving averages (20, 50, 100, and 200-day), and each of these averages is itself moving upward, confirming the trend's width and staying power.
This mix of points indicates SU is not just having a brief rise but is in a maintained uptrend, making it a fitting choice for a breakout-focused method.
Setup Quality: A Pause Before the Next Action
While technical strength shows the direction, setup quality helps find the timing. A high setup rating means a stock is pausing or forming a base, which can give a more precise entry point with clear risk. Suncor's setup rating of 8 shows a good consolidation pattern is present.
The technical report points out several traits of this setup:
- Narrow Trading Range: In the last month, SU has traded in a small area between $43.34 and $45.60, showing a balance between buyers and sellers and less price movement.
- Bull Flag Pattern: The analysis states the stock is now showing a bull flag pattern, a short, downward-moving pause after a strong rise. This pattern is frequently seen as a rest before a possible continuation of the earlier uptrend.
- Clear Support and Resistance: The pause has made clear borders. A main resistance area is between $44.44 and $45.21, while support is near $44.31. For breakout traders, a move above this resistance could mean the end of the pause and the start of a new upward stage.
- Recent Volume Activity: The report states that volume has been "much higher in the last couple of days," which can happen before a notable price change as larger investor activity increases.
Trade Plan and Risk Points
From the technical and setup study, an example trade plan is offered. The suggested entry is a buy-stop order at $45.22, set just above the noted resistance area. A stop-loss order at $44.28, set below the nearby support, would set the risk. This makes a risk of about $0.94 per share, or 2.08%.
It is key to remember that this specific setup, like all technical patterns, is not certain to work. The space between the suggested entry and exit is fairly small compared to the stock's average daily range, which might result in a greater chance of being stopped out by ordinary market changes. Traders should always do their own study, thinking about points like wider market conditions, now positive for the S&P 500, and any coming company-specific news like earnings reports.
Locating Comparable Chances
Suncor Energy shows the kind of chance technical breakout screens are made to find. For investors looking to scan for other stocks showing sound technicals and interesting setups, new choices are found each day. You can view the present list of possible breakout setups by going to the Technical Breakout Setups screen.
Disclaimer: This article is for information only and is not investment advice, a suggestion, or an offer to buy or sell any security. The study uses technical indicators and past data, which do not assure future results. All trading and investment choices have risk, including the possible loss of the amount invested. You should do your own research and talk with a qualified financial advisor before making any investment choices.