
For investors who use charts and price action to guide their choices, a methodical way to find possible trades is important. One such technique looks for stocks that show both good basic technical condition and a distinct, usable price pattern. This idea centers on finding securities that are in clear upward trends but are now in a period of little movement, indicating they may be preparing for their next notable price change. By joining a high technical score, which verifies the trend's force, with a high setup quality score, which finds a useful pause, traders try to find chances where the risk and potential gain are clear.
STEEL DYNAMICS INC (NASDAQ:STLD) recently appeared from this kind of screening process, showing a profile that fits well with this breakout approach. The company, a significant business in steel production and metals recycling, seems to be forming a technical picture that deserves more attention from investors focused on charts.
Looking at the Technical Base
The first part of this strategy is verifying the stock's overall technical condition. A high technical score shows a security is in a good upward trend, doing better than the wider market, and is usually seen as a leading issue. This matters because starting a trade in a stock with good momentum raises the chance that the current trend will keep going after a breakout.
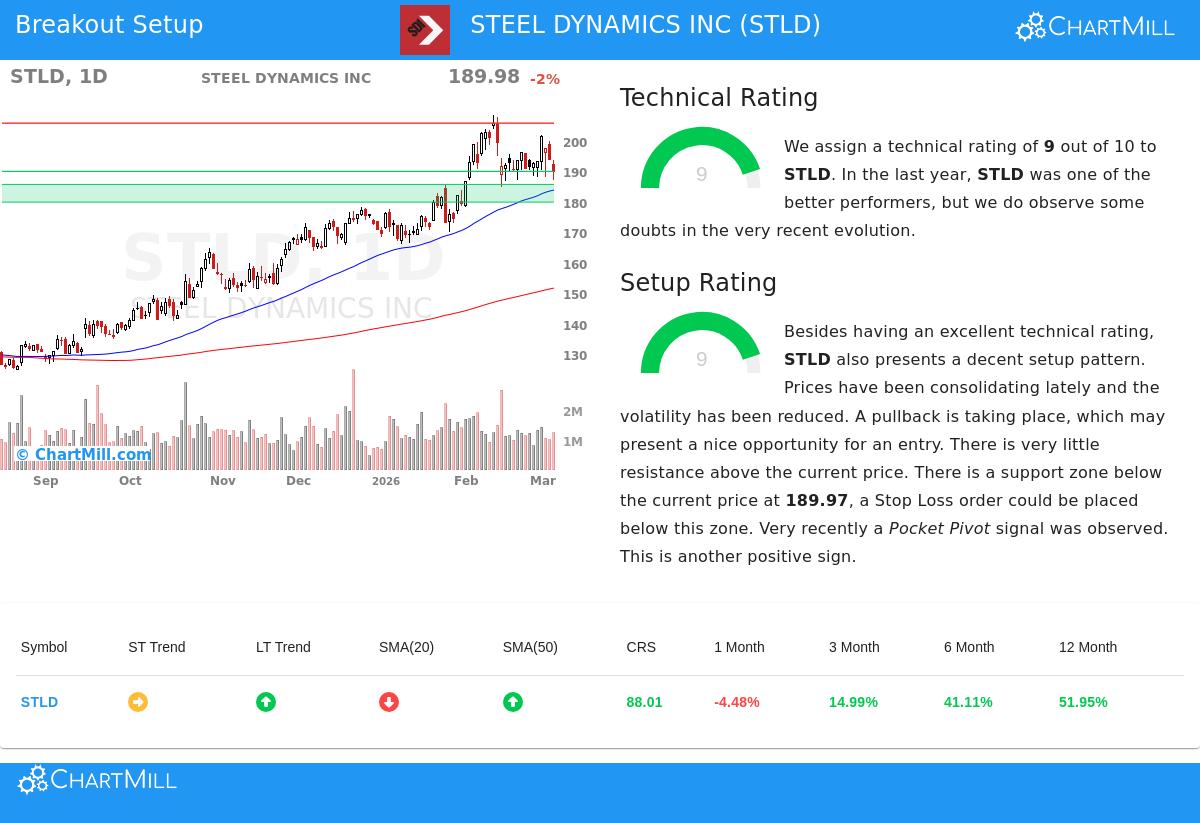
Based on the detailed ChartMill Technical Report, STLD gets a solid technical score of 9 out of 10. This number is backed by several important measures:
- Long-Term Trend: The long-term trend is seen as positive, which is the main reason for a high technical score. This creates a good setting for any short-term trade setup.
- Relative Strength: The stock's performance over the past year is better than 88% of all other stocks, showing clear better performance.
- Moving Average Position: The stock is priced above its important rising moving averages (50-day, 100-day, and 200-day), a typical sign of a positive trend structure.
- Market Level: STLD is trading in the higher part of its 52-week range, although it is seen as a little behind the S&P 500's recent peaks.
This group of factors describes a stock in a strong upward trend, answering the "which stock" question by pointing to STLD as a technically good choice.
Judging the Setup Quality
A good trend by itself is not a buy signal; entering at a bad moment can lead to quick losses. The second key piece is the setup quality, which checks if the stock is making a logical pattern that gives a clear point to enter and exit. A high setup score often shows a time of little movement or lower price swings, where the price action becomes tighter, frequently forming a base from which the next upward step can begin.
STLD does well here too, with a setup score of 9. The technical report states that "prices have been consolidating lately and the volatility has been reduced." This is shown by the stock trading in a specific range over the last month. More exactly, the analysis finds:
- A Specific Support Area: A key part for managing risk is a close support level. The report points out a firm support area at $189.97, made by several trendlines and moving averages across different time periods.
- Lowered Volatility: The period of little movement has caused a tightening of price action, which often comes before a move in one direction.
- A Positive Indicator: The report also mentions a recent "Pocket Pivot" signal, a volume-based indicator that can point to buying by larger investors during a phase of little movement.
This high-quality setup speaks to the "when to buy" question. It indicates the stock is not stretched too far but is instead pausing in a controlled way, giving a possible entry point with a sensible place to put a protective stop-loss order under the noted support.
Trade Plan and Market Setting
The automatic analysis based on these scores proposes a possible trading setup with an entry just above the 10-day moving average at $194.04 and a stop-loss put under the support area at $189.96. This confines the theoretical worst-case risk on the trade to about 2.1%. It is important to recall that this is an example created from the technical measures; each investor should always do their own study to decide suitable entry, exit, and position size that matches their own risk comfort.
The wider market setting adds a notable detail. While the S&P 500's short-term trend is positive, its long-term trend is currently negative. In this situation, money often moves toward sectors and stocks showing better relative performance. STLD's high technical and setup scores suggest it is one of the market's more solid members, which could make it a target for money looking for leading issues during a time of wider market doubt.
Locating Comparable Chances
The screening process that found STEEL DYNAMICS INC is used each day to the market. For investors wanting to find other stocks that now show high technical scores together with high-quality setup patterns, the outcomes are available through the Technical Breakout Setups screen. This tool methodically sorts for securities that meet these strict conditions, giving a selected beginning point for more technical study.
Disclaimer: This article is for information only and does not form investment advice, a suggestion, or an offer to buy or sell any security. The study is based on technical measures and automatic reports. Investing has risk, including the possible loss of principal. Always do your own research and think about talking with a qualified financial advisor before making any investment choices. Past results do not guarantee future outcomes.