
For technical investors, finding stocks that are in a solid trend and ready for a further move is a central goal. One way to do this is by searching for stocks with high proprietary ratings for both technical condition and setup condition. This method selects for market leaders that are not only moving upward but are also pausing in a narrow range, indicating a possible breakout is near. By using these two measures together, traders try to locate chances where a stock with good technicals is presenting a defined, lower-risk entry for a possible next upward move.
Sensata Technologies Holding (NYSE:ST), a global industrial technology company that focuses on sensors and electrical protection systems, now offers a clear example for this method. According to its ChartMill Technical Analysis report, the stock receives a perfect score on both main aspects, making it a notable candidate from a technical breakout search viewpoint.
Technical Condition: The Base of a Leader
The first part of the breakout method is finding stocks with solid basic technical condition. A high technical rating shows a stock is in a verified uptrend across various time periods and is performing better than the wider market. Sensata Technologies does well here, having a top-level technical rating of 10.
The report lists a number of elements adding to this high score:
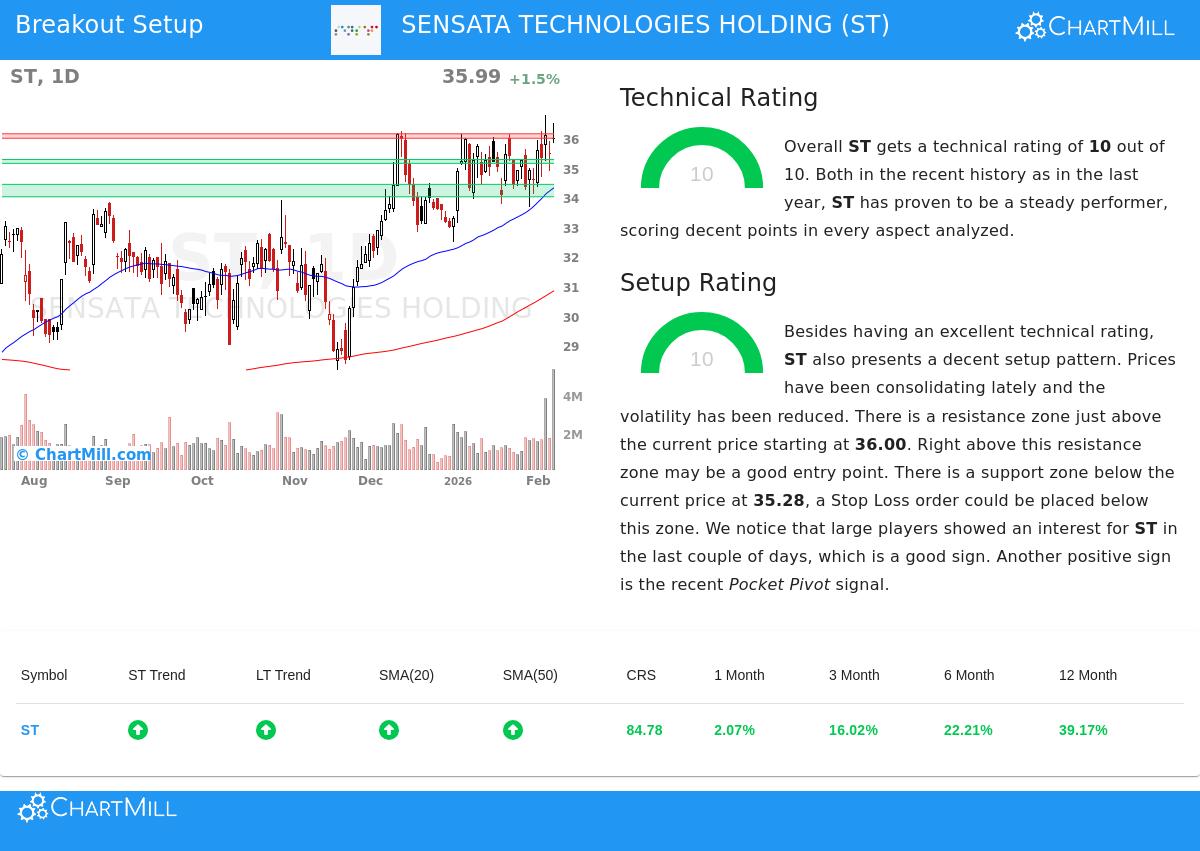
- Trend Direction: Both the near-term and longer-term trends for ST are rated as positive, a united bullish sign that points to continued momentum.
- Price vs. Moving Averages: The stock is priced above all its main simple moving averages (20, 50, 100, and 200-day), and each of these averages is also in a rising pattern. This layered arrangement of support levels is a standard trait of a solid uptrend.
- Market-Relative Performance: ST is doing better than 84% of all stocks in the market over the last year, a definite sign of institutional support and leadership. It is also trading close to its 52-week high, confirming its place with the market's better performers.
This group of factors means ST is not only rising, it is doing so with steadiness and force compared to similar stocks. For a breakout method, this technical soundness is key because it raises the chance that any breakout from a pause will be maintained instead of quickly failing.
Setup Condition: Finding the Pause
A solid trend by itself is not a signal to buy, entering after a fast rise involves notable risk. The second part of the method centers on timing, looking for stocks that are resting within their uptrend. This pause, shown by a high setup condition rating, forms a possible base from which the next rise can start. Sensata Technologies also gets a perfect 10 in this area.
The technical report points out the conditions that describe this good setup:
- Narrow Trading Range: Over the last month, ST has been pausing within a set range between about $33.66 and $36.79. This time of lower volatility and sideways movement lets moving averages draw nearer and stores energy for a possible breakout.
- Defined Support and Resistance: The analysis finds a clear support area around $35.28 and a main resistance area just above the present price, between $36.00 and $36.15. These defined levels give clear reference points for planning trade entries and exits.
- Supporting Indicators: The report mentions recent "Pocket Pivot" activity, a volume-based accumulation pattern, and attention from large investors, both of which can be extra confirmations of basic strength during the pause phase.
This high setup score answers the important "when" question for a trader. It shows that ST is not stretched too far but is instead tightening within its uptrend, preparing for a possible clear move above resistance.
A Possible Breakout Situation
The combination of a perfect technical rating and a perfect setup rating forms a specific, rule-based trading idea. The automated analysis proposes a possible breakout setup if the stock moves through the identified resistance.
- Entry Trigger: A move above the resistance area, specifically above $36.16.
- Risk Management: A stop-loss order set below the nearby support area, around $35.14, to contain loss if the breakout does not work.
- The Idea: A successful move through the $36.00-$36.15 resistance area on strong volume could mark the end of the pause period and the start of the next upward phase in ST's confirmed uptrend.
It is key to remember that this is a display of the technical pattern as found by the search method, not a suggestion. The nearness of the proposed stop-loss to the entry point creates a fairly close trade structure, which may not fit all risk preferences.
Locating Comparable Chances
The example of Sensata Technologies shows how using technical condition with setup condition can find possible breakout candidates. For investors wanting to use this method to locate other similar setups in the present market, new results are created each day. You can see the most recent technical breakout candidates by going to the Technical Breakout Setups screen.
Disclaimer: This article is for information and learning only. It is not investment advice, a suggestion, or an offer to buy or sell any security. The technical analysis and possible trade setups described are from automated measures and past data, which are not assurances of future results. Investors should do their own research, think about their personal financial position and risk comfort, and talk with a qualified financial advisor before making any investment choices.