
For investors who use charts and price action to guide their choices, a methodical way to find possible trades is important. One technique looks across the market for stocks that are both technically sound and creating a particular price formation. This plan centers on locating equities with a high "Technical Rating," which shows a good, confirmed uptrend, and a high "Setup Quality Rating," which points to a time of sideways movement that might come before a new upward move. The aim is to find stocks where a move above this sideways range could present a good chance for entry to follow the current trend.
A recent filter using this approach has pointed to Sensata Technologies Holding (NYSE:ST) as an example for more review. The industrial sensor maker seems to be matching the conditions that technical investors frequently look for when seeking moves above a range.
Looking at the Technical Base
The first part of this plan is a stock's basic technical condition, measured by ChartMill's Technical Rating. A high rating implies a stock is in a verified uptrend over various periods, helped by elements like good moving averages and solid performance compared to the market. Sensata's technical picture shows a number of these good traits.
- Trend Agreement: Both the longer and shorter-term trends for ST are seen as good. This agreement is a main sign of continued buying and lessens the disagreement that can happen when time periods show different pictures.
- Moving Average Help: The stock is priced above all its main simple moving averages (20, 50, 100, and 200-day), and each of these averages is also in a rising pattern. This layered, positive arrangement of support levels is a standard mark of a sound uptrend.
- Price Level: ST is now priced close to its 52-week high. While the wider S&P 500 is also near highs, the stock's capacity to hold this high level shows it is joining the market's good performance, not falling behind it.
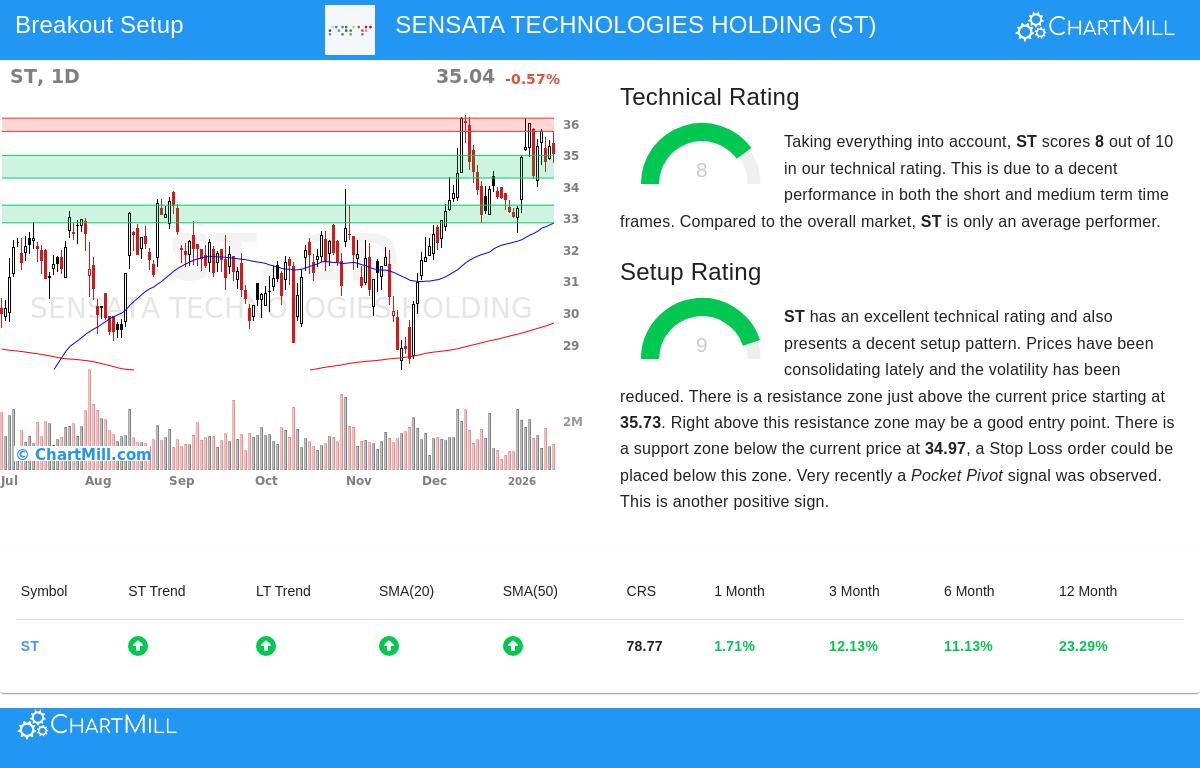
According to the detailed technical report, ST gets a Technical Rating of 8 out of 10. This number shows the stock's acceptable performance across short and medium-term periods and puts it in a good spot compared to most stocks. For the move-above-range plan, this firm technical foundation is required; it gives the directional expectation and speed that a successful move above a range tries to use.
Judging the Setup Quality
A good trend by itself is not a signal to buy. Entering a stock that has already made a big, prolonged move often results in buying at a high point. The second important filter is the Setup Quality Rating, which finds times of sideways or "tight" trading inside the wider trend. These stages let a stock absorb its earlier gains and form a new base of support from which to move up.
Sensata shows an interesting setup, getting a high Setup Rating of 9. This score comes from several visible factors on the chart.
- Sideways Formation: Over the last month, ST has been trading in a set area between about $32.50 and $36.14. It is now testing the top edge of this area. This time of sideways movement after an upward move is the consolidation formation the filter is made to find.
- Clear Support and Resistance: The technical review finds a definite support area between $34.25 and $34.97, made by a mix of trendlines and moving averages. Just above the present price sits a resistance area between $35.73 and $36.15. These set levels are needed for planning a trade, as they give reasonable points for a move-above trigger and a protective stop-loss.
- Helpful Technical Signs: The report also mentions a recent "Pocket Pivot" signal, a volume-based formation that can point to accumulation by large investors during a sideways phase, adding more reason to believe in the setup's quality.
For a technical trader, this high-grade setup answers the "when" to buy. It suggests the stock is tightening, with possible decreasing price swings, which creates the conditions for a clear move. The nearness to set resistance gives a clear level to observe for a possible move-above confirmation.
A Possible Trade Plan
From this review, a standard technical setup appears. The plan would involve waiting for ST to clearly move above the found resistance area, suggesting the sideways period has ended and the earlier uptrend is starting again.
- Entry: A buy order could be set just above the resistance, maybe near $36.16, to confirm the move above.
- Exit/Stop-Loss: A protective stop-loss order could be placed just below the close support area, near $34.24, to control loss if the move above does not hold.
- Risk Control: This plan would set a risk of about 5.3% on the trade itself. Trade size could then be changed to make sure this trade risk fits with an investor's total account risk comfort.
It is important to note that this is a sample case taken from the technical readings. The real resistance and support levels change, and traders must always do their own review, thinking about elements like coming earnings reports or industry news that could affect price movement.
Locating Other Chances
Sensata Technologies is one case found through a methodical filter for technical move-above-range setups. Investors wanting to use this approach to find other possible chances can run the filter themselves. You can find new, daily results from the Technical Breakout Setups filter here.
Disclaimer: This article is for information and learning only. It is not meant as investment advice, a suggestion to buy or sell any security, or a plan for any specific investment method. The review is based on technical data and automated reports, which can change. All investment choices include risk, including the possible loss of the amount invested. You should do your own research and talk with a qualified financial advisor before making any investment choices.