
Sempra (NYSE:SRE) has been found using a methodical screening process made to identify stocks showing good conditions for technical breakouts. This process uses two specific indicators: the ChartMill Technical Rating, which measures the general technical condition and trend force of a stock, and the ChartMill Setup Quality Rating, which judges the condition of its present consolidation shape. Stocks that achieve high marks on both measures are seen as leading choices, as they are technically solid assets that are also forming into a possible breakout move, giving a specific entry point with set risk limits.
Technical Strength Evaluation
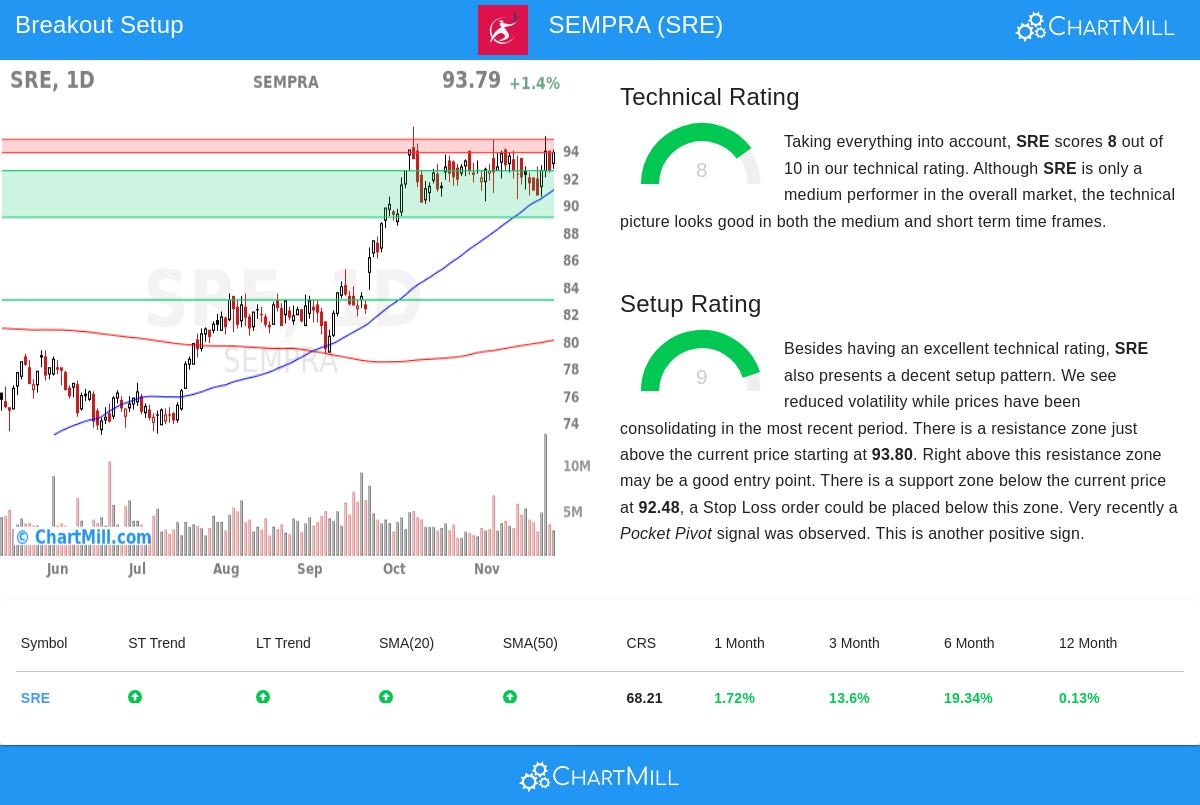
The base of a workable breakout candidate is a firm basic trend, and Sempra shows notable force in this part. The stock's ChartMill Technical Rating of 8 out of 10 means a technically sound profile, an important filter for making sure we are trading with the existing momentum. A closer inspection of the technical report shows the reasons for this high rating:
- Positive Trends: Both the near-term and longer-term trends are labeled positive, giving multi-timeframe agreement of the stock's upward direction.
- Strong Momentum Indicators: The stock is priced above all its main moving averages (20, 50, 100, and 200-day), and each of these averages is itself in a rising arrangement.
- Nearness to Highs: Sempra is presently priced close to its 52-week high, a feature frequently seen with leading stocks. Its results over the past three and six months, at 13.6% and 19.3% in turn, further highlight this positive momentum.
This mix of elements means that when Sempra breaks out, it is doing so from a place of force, raising the chance that the move will continue instead of being quickly undone.
Setup Quality and Consolidation Shape
While a forceful trend is necessary, a good entry point is just as important. This is where the Setup Quality Rating becomes useful, as it finds times of consolidation that often come before a notable price move. Sempra's high Setup Rating of 9 shows it is now in such a stage. The examination indicates several main features of a high-condition setup:
- Lowered Volatility and Narrow Range: The stock has been trading in a narrow band between about $90 and $95 over the past month. This squeezing of price action stores energy and often results in a forceful expansion, or breakout.
- Bull Flag Formation: The technical report states that Sempra is presently showing a bull flag pattern. This is a typical continuation pattern where prices decline a little in a controlled way after a forceful rise, usually ending with a return of the uptrend.
- Clear Support and Resistance: The setup finds a specific support area below the present price and a resistance area just above it. This gives a clear plan for traders, with a possible entry point above resistance and a reasonable stop-loss level below support.
- Supportive Volume Activity: A recent pocket pivot signal, which shows buying on higher-volume up days, adds more weight to the positive condition of the present setup.
Trading Points
For traders watching this setup, the technical examination indicates a possible trading plan. A breakout above the resistance area, specifically above $94.78, could be used as a signal for entry. To control risk, a stop-loss order could be set below the nearby support area, around $90.37. This sets the trade's risk to about 4.65% of the entry price, allowing for exact position sizing. It is important to recognize that this is an example created from the technical information; traders should always adjust their entry, exit, and position size to their personal risk comfort and plan.
The method that found Sempra can be used to find new chances every day. For investors looking for other possible breakout choices that fit similar standards of strong technicals and high-condition setups, the live screening results can be seen using the Technical Breakout Setups screen.
Disclaimer: This article is for informational purposes only and does not constitute investment advice of any kind. The analysis and any suggested trade parameters are based on technical indicators and are generated automatically. They should not be interpreted as a recommendation to buy or sell any security. All investing and trading involves risk, including the possible loss of principal. Always conduct your own research and consider your individual financial situation before making any investment decisions.