
For investors who use technical analysis to find possible opportunities, the search often comes to two main questions: which stock is in a solid trend, and when is the correct time to purchase it? A methodical way to answer these questions is to look for stocks that mix sound technical condition with a good-quality consolidation pattern, indicating a possible breakout. This process selects for equities with solid basic momentum that are also pausing to gather energy for their next advance, providing a more distinct entry point with clear risk.
One stock currently matching this description is Sempra (NYSE:SRE), the San Diego-based energy infrastructure holding company. According to a recent technical analysis report, SRE presents a strong case for investors observing breakout formations.
Technical Strength: The Base of the Trend
The first part of this method is finding stocks with better technical condition, often measured by a high technical rating. This rating evaluates items like relative strength, trend direction, and price compared to important moving averages. A high number shows a stock is in a confirmed uptrend and is a market leader, which is important because breakouts from consolidation happen more successfully when they occur during a current bullish trend.
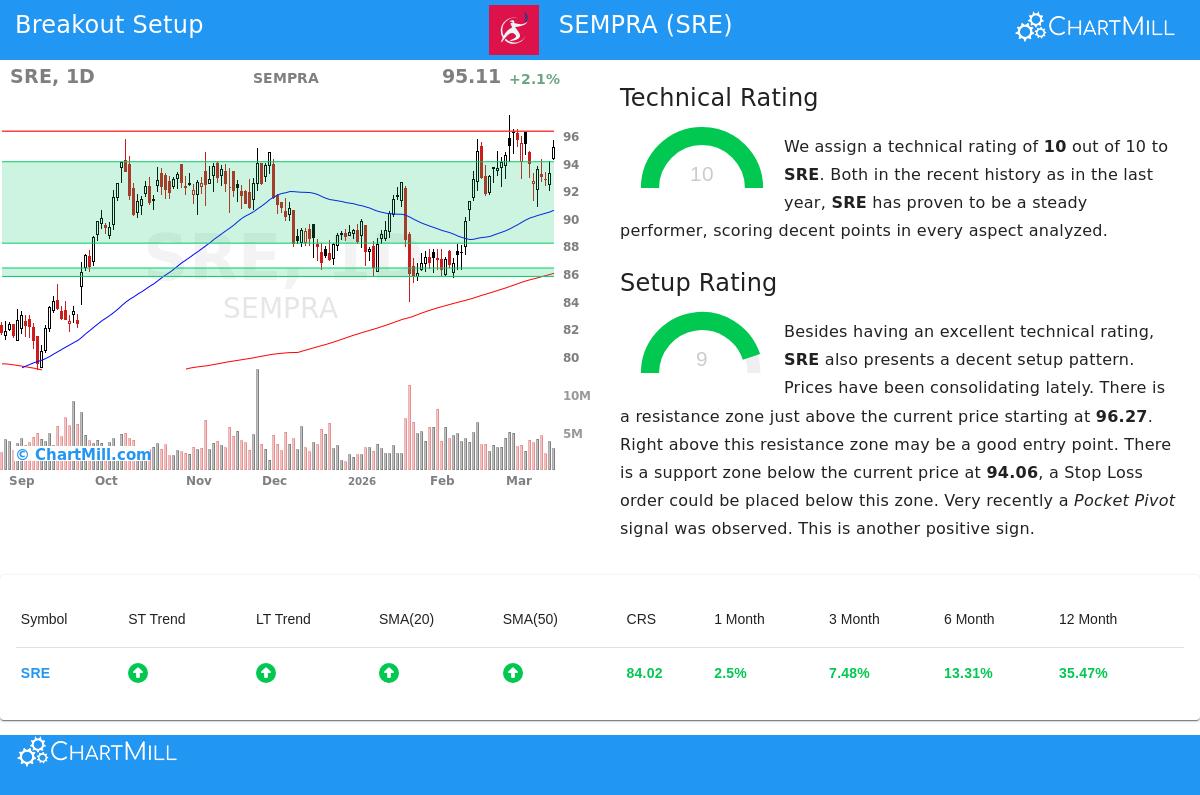
Sempra does very well in this basic area. The stock’s technical rating is a full 10 out of 10. The detailed technical report points out several positive points that add to this top number:
- Trend Agreement: Both the long-term and short-term trends for SRE are listed as positive. This agreement across different periods indicates continued buying pressure and lowers the chance of a false breakout.
- Market and Industry Performance: SRE is doing better than 84% of all stocks in the market over the last year and is in the top 8% of its Multi-Utilities industry. It is also trading close to its 52-week high while the wider S&P 500 is not, showing clear relative strength.
- Sound Moving Average Backing: The stock is trading above all its main simple moving averages (20, 50, 100, and 200-day), and each of these averages is rising. This layered support formation is a typical sign of a sound, trending stock.
Setup Quality: Finding the Consolidation
A solid trend by itself is not a buy signal; entering after a fast rise brings the chance of a quick decline. The second important filter is the setup quality rating, which measures the condition of a stock's consolidation pattern. A high number indicates the stock has been trading in a narrow range, volatility is falling, and a clear level of support has formed. This creates a possible "launch point" for the next upward move and allows for a sensible placement of a protective stop-loss order.
Sempra’s setup quality rating is a very good 9 out of 10. The analysis shows the stock has been forming a base for its next possible move:
- Consolidation Happening: Over the last month, SRE has traded in a band between about $90.81 and $97.44. It is currently consolidating in the middle of this band, which the report states "may present a good entry opportunity."
- Clear Support and Resistance: The technical analysis finds a definite support area between $88.16 and $94.06, made by a mix of trendlines and moving averages. Just above the current price, a resistance area is noted at $96.27. A clear move above this resistance could indicate the beginning of a new breakout stage.
- Positive Volume Activity: The report also notes a recent "Pocket Pivot" signal, a formation where the stock moves up on volume greater than the highest down volume seen in the previous ten days. This can be an early indicator of institutional buying during a consolidation.
A Possible Breakout Situation
The mix of a full technical rating and a good-quality setup forms the center of the breakout idea for Sempra. The automated analysis proposes a specific, rules-based situation: an entry could be thought about on a break above the $96.27 resistance level, with a stop-loss placed below the nearby support area around $90.80. This would state the trade's risk clearly from the start, a main rule of disciplined technical trading.
It is important to remember that this is a created example based only on price action and technical indicators. Investors should always do their own research, thinking about fundamental items and upcoming company events like earnings reports, before making any investment choice.
Looking for more possible breakout ideas? You can run the same screen that found SRE using the Technical Breakout Setups screener to see a daily-updated list of stocks meeting similar technical and setup conditions.
Disclaimer: This article is for informational purposes only and does not constitute investment advice, a recommendation, or an offer to buy or sell any security. The analysis presented is based on technical indicators and automated reports. All investments involve risk, including the potential loss of principal. You should conduct your own research and consult with a qualified financial advisor before making any investment decisions.