
Technical breakout strategies aim to identify stocks with strong momentum that are consolidating in preparation for their next upward move. This approach combines two critical elements: a sound technical foundation indicating the stock is in a sustainable uptrend, and a high-quality setup showing recent price consolidation that provides clear entry and exit points. By focusing on securities that demonstrate both characteristics, investors seek to participate in the next leg of a stock's advance while managing risk through well-defined support levels.
Technical Strength Assessment
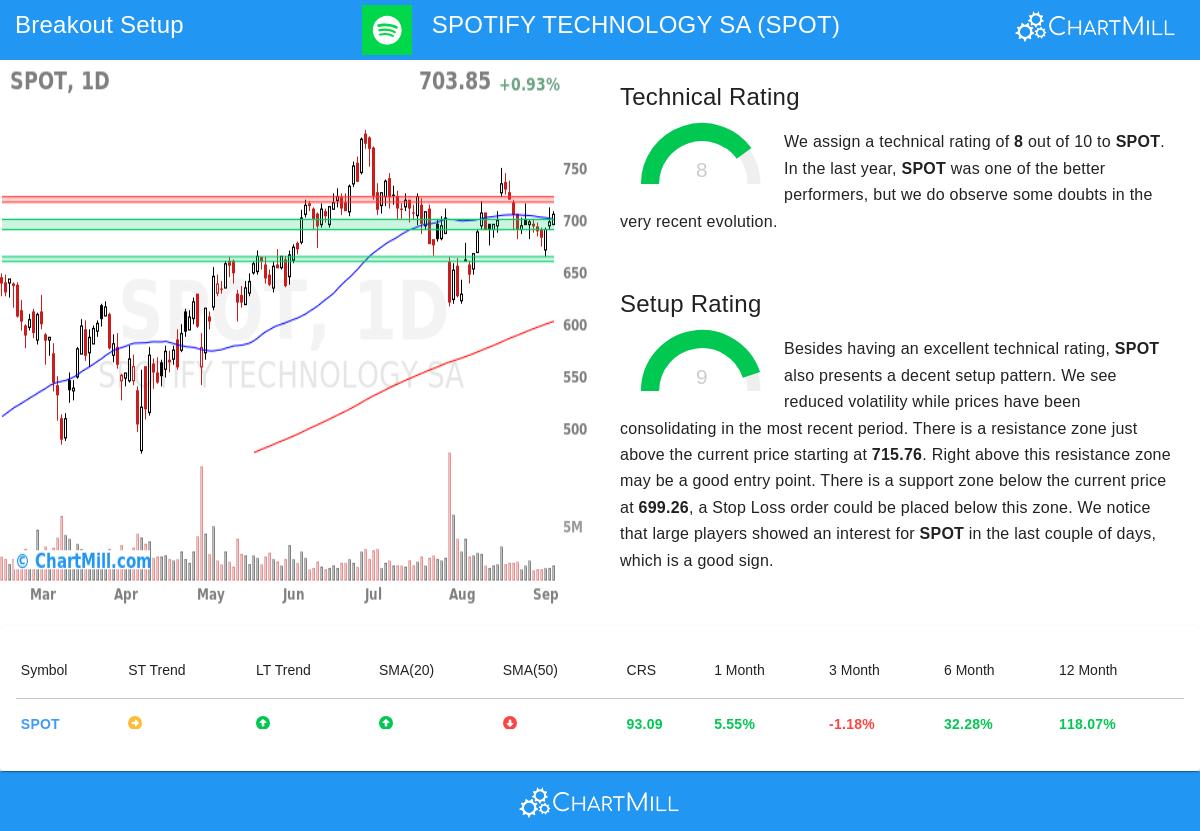
SPOTIFY TECHNOLOGY SA (NYSE:SPOT) demonstrates notable technical strength with a ChartMill Technical Rating of 8 out of 10, placing it firmly in the upper tier of technically sound stocks. This rating reflects multiple positive factors that technical investors look for when identifying market leaders. The stock maintains a positive long-term trend despite recent neutral short-term action, suggesting the overall upward trajectory remains intact. Its relative strength metrics are particularly impressive, with the stock outperforming 93% of all stocks in the market over the past year and ranking in the top 15% within its entertainment industry peer group.
Key technical strengths include:
- Consistent performance across multiple timeframes with positive 1-month (+5.55%), 6-month (+32.28%), and 12-month (+118.07%) returns
- Trading above all major moving averages (20-day: $698.80, 50-day: $699.26, 100-day: $673.67, 200-day: $601.67)
- Strong volume profile with average daily volume exceeding 2 million shares, ensuring adequate liquidity
These characteristics matter because a high technical rating indicates the stock possesses the underlying momentum necessary to sustain future advances, making it more likely to successfully break out from consolidation patterns.
Setup Quality Analysis
The stock presents an excellent setup pattern with a ChartMill Setup Rating of 9 out of 10, indicating superior consolidation qualities that technical investors seek. Recent trading activity shows reduced volatility with prices consolidating within a defined range between $663.06 and $748.30 over the past month. The current price of $703.85 sits in the middle of this range, having established multiple support levels that provide clear risk management points for potential entries.
Critical setup elements include:
- Three well-defined support zones at $689.44-$699.26, $658.91-$663.58, and $620.00-$636.67
- A clear resistance zone between $715.76 and $720.91 that defines the potential breakout level
- Recent accumulation patterns showing institutional interest, as measured by the Effective Volume indicator
This consolidation pattern is significant because it represents the "pause that refreshes" within an ongoing uptrend. The tight trading range after previous advances allows the stock to work off overbought conditions while building energy for the next potential move higher. The high setup rating specifically indicates that current prices remain close to short-term moving averages, volatility has decreased, and support zones are clearly established, all characteristics of high-quality breakout setups.
Trading Considerations
The technical analysis suggests a potential breakout entry above $720.92, which would represent a move above the identified resistance zone. This level matters because breaking through established resistance often signals renewed buying interest and can trigger accelerated price movement. The suggested stop loss at $689.43, placed below the primary support zone, would represent a 4.37% risk on the trade, providing a favorable risk-reward setup for technical traders.
For position sizing, the analysis indicates that for a 1% total portfolio risk, investors could allocate approximately 23% of their capital to this potential trade. However, traders should note that the distance between the suggested entry and exit points represents only 1.44 times the average true range, suggesting they might want to evaluate whether wider stops better suit their trading style given the stock's volatility characteristics.
Market Context and Additional Opportunities
The current market environment, with both short and long-term S&P 500 trends positive, provides a supportive backdrop for breakout strategies. While SPOTIFY TECHNOLOGY SA shows promising characteristics, technical investors should remember that breakout screening is most effective when conducted regularly to identify fresh opportunities as market conditions evolve.
For investors interested in exploring additional technical breakout candidates, the Technical Breakout Setups Screen provides daily updated results using the same methodology that identified SPOT. This tool combines both technical ratings and setup quality scores to present the most notable breakout opportunities in the current market environment.
Disclaimer: This analysis is based on technical indicators and pattern recognition and should not be considered investment advice. The discussed trading setup is provided for educational purposes only. Investors should conduct their own research, consider their risk tolerance, and consult with financial professionals before making any investment decisions. Past performance does not guarantee future results, and technical analysis has inherent limitations.