
Financial markets offer many chances for investors looking for expansion, and one technique to find good options joins basic momentum with chart-based study. This method centers on businesses showing solid profit and revenue speed—important features wanted by growth momentum investors—while also displaying good technical condition and basing formations that indicate possible breakout chances. By filtering for stocks with strong scores in these areas, investors can find securities that not only show basic potential but are also situated well on the price charts.
High Growth Momentum Basics
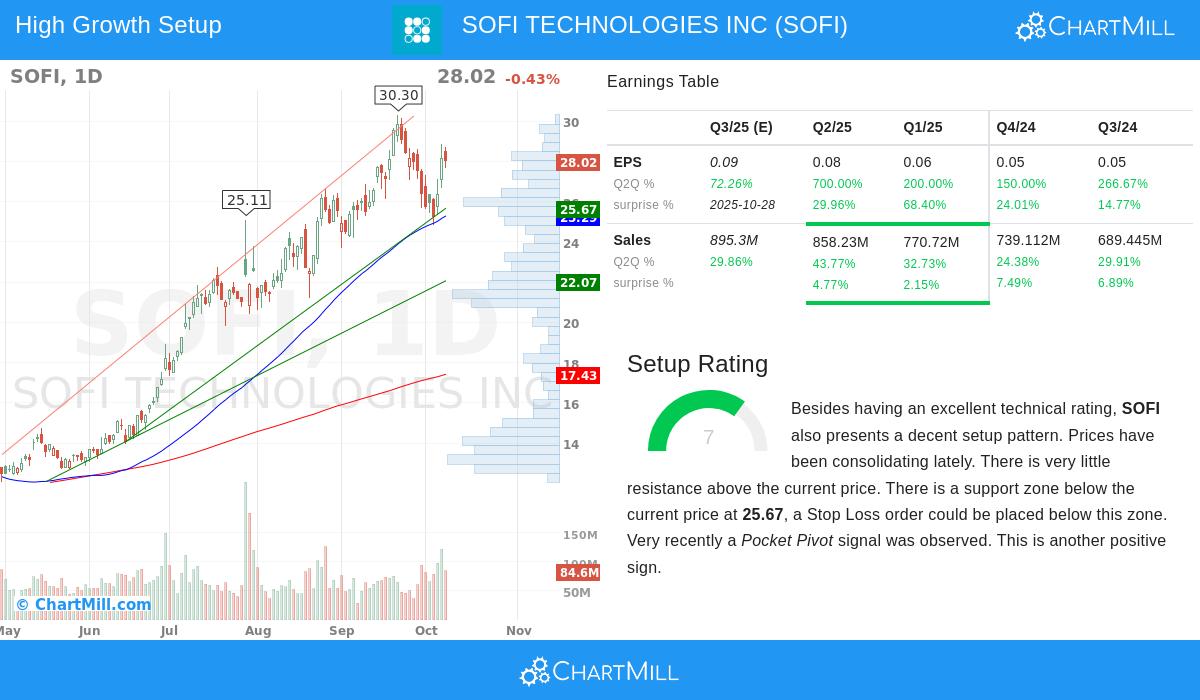
SOFI TECHNOLOGIES INC (NASDAQ:SOFI) shows a number of traits that match high growth momentum investing. The plan focuses on businesses with speeding up profits, growing earnings margins, and good analyst changes—elements that frequently come before continued upward price action. SOFI's current results emphasize its fit:
- Strong EPS Growth: The business announced a 700% year-over-year EPS rise in the newest quarter, after 200% growth in the quarter before and 150% growth two quarters earlier. This speeding up formation is just what momentum investors look for.
- Steady Sales Growth: Quarterly revenue growth has stayed good, with the newest quarter showing 43.8% year-over-year growth. The company has exceeded revenue forecasts in each of the past four quarters by an average of 5.3%.
- Earnings Margin Growth: SOFI's earnings margin got better to 11.4% in the newest quarter from 9.2% in the previous quarter, showing the business's skill to turn revenue growth into net profits.
- Analyst Belief: EPS forecasts for the next year have been changed higher by 12.9% over the past three months, showing increasing positive feeling about the business's future.
These basic measures add to SOFI's High Growth Momentum Score of 6, putting it much higher than the lowest level wanted by growth investors. The mix of speeding up profits, growing margins, and good forecast changes forms a strong basic view.
Chart-Based Health and Market Standing
From a chart-based view, SOFI shows very good health that matches its basic story. The stock gets a full Technical Score of 10, showing better chart-based health over many time periods. This score looks at elements including relative performance, trend path, and moving average agreement—all important parts for finding market leaders.
- Trend Health: Both near-term and longer-term trends are good, with the stock priced higher than all main moving averages (20-day, 50-day, 100-day, and 200-day)
- Market Beating: SOFI has done better than 96% of all stocks over the past year and shows better relative performance in the Consumer Finance field, doing better than 94% of similar businesses
- Price Movement: The stock is priced close to its 52-week peak of $30.30, showing continued buyer interest and momentum
The stock's chart-based leadership is especially notable given the present market situation, where the S&P 500 shows good longer-term and near-term trends. SOFI's ability to do much better in this setting emphasizes its chart-based health.
Formation Quality and Trading Points
SOFI shows a Formation Score of 7, showing a good basing formation that might come before another move upward. The formation study finds specific traits that make the current price action especially noteworthy for breakout traders:
- Basing Area: Prices have been moving between $24.84 and $30.30 over the past month, making a clear range
- Support Base: A solid support area exists between $25.24 and $25.67, made by several trend lines and moving averages over different time periods
- Recent Sign: A pocket pivot sign was lately seen, showing big buyer accumulation
According to the technical analysis report, the mix of very good technical scores and acceptable formation patterns makes an interesting risk-reward situation. The study indicates possible entry above $28.85 with support working as a sensible stop-loss level.
Investment Meaning
For investors using a high growth momentum plan, SOFI stands as an interesting example where solid basics match with chart-based quality. The business's exceptional EPS growth, margin growth, and good forecast changes give the basic drive, while the full technical score and positive formation offer good timing points. This match is exactly what the joined filtering system tries to find—businesses with both growth momentum and chart-based placement that indicates continued upward movement.
The filtering system that found SOFI keeps finding possible chances across the market. Investors curious about finding similar high growth momentum stocks with good chart-based formations can review more filtering outcomes that meet these strict requirements.
Disclaimer: This study is for information only and does not make investment guidance. All investment choices should come from personal study and risk comfort. Past results do not ensure future outcomes.