
In the world of growth investing, combining technical strength with fundamental momentum is a strategy popularized by legendary trader Mark Minervini. His approach emphasizes identifying stocks in strong uptrends, using criteria like moving averages, relative strength, and price performance, while also ensuring solid underlying growth in earnings, revenue, and profitability. This dual focus helps investors capture stocks with both chart momentum and business acceleration, reducing risk and improving potential returns. One stock that currently stands out under this framework is SoFi Technologies Inc (NASDAQ:SOFI).
Technical Strength and Trend Template Alignment
SOFI displays a strong technical profile that aligns closely with Minervini’s Trend Template, which requires stocks to be in a clear Stage 2 uptrend with strong momentum indicators.
Key technical criteria met by SOFI include:
- Trading above its 150-day and 200-day moving averages, with both trending upward.
- The 50-day moving average positioned above the 150-day and 200-day averages, confirming layered bullish momentum.
- A current price more than 30% above its 52-week low and within 25% of its 52-week high, indicating sustained strength without being overextended.
- A relative strength ranking above 98, meaning it outperforms nearly all stocks in the market.
These factors together signal that SOFI is in a clear uptrend with institutional support and positive price momentum, a key part of Minervini’s strategy for identifying leaders.
Fundamental Growth and Momentum
Beyond technicals, Minervini’s method stresses the importance of fundamental acceleration, particularly in earnings, revenue, and profit margins. SOFI demonstrates high growth metrics that appeal to high-growth investors.
Notable fundamental highlights:
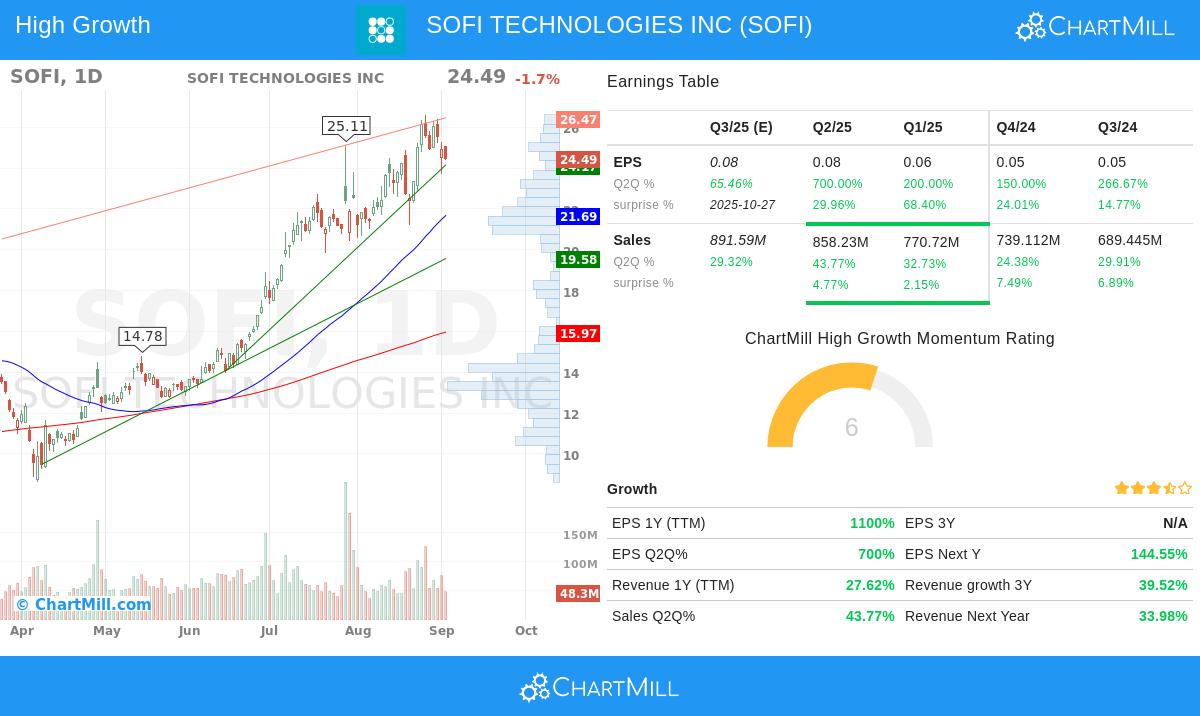
- Earnings per share (EPS) growth has been explosive, with a trailing twelve-month (TTM) increase of over 1,000% and recent quarterly growth rates exceeding 100%.
- Revenue growth remains solid, with a TTM increase of nearly 28% and recent quarterly sales growth consistently above 20%.
- The company has beaten EPS estimates in each of the last four quarters, with an average surprise of over 34%, indicating sustained operational outperformance.
- Profit margins have shown improvement, and analyst revisions for future earnings and revenue have been upward, reflecting optimism about continued growth.
These metrics are critical because Minervini believes that “big earnings attract big attention”—fundamental acceleration often precedes and fuels further price appreciation, especially when combined with technical breakouts.
Sector and Market Context
SOFI operates in the consumer finance industry, a sector that has seen renewed interest amid changing financial technologies and consumer behavior. With a relative strength ranking that places it in the top 2% of all stocks and top performers within its industry, SOFI is showing leadership, a key trait Minervini looks for in potential high-flyers. The stock’s ability to outpace the broader market, even as the S&P 500 trends positively, highlights its independent strength.
Risk and Reward Profile
While the setup is promising, investors should note that SOFI’s volatility and current price proximity to its 52-week high require careful risk management. The stock’s technical analysis suggests a support zone near $24, which could serve as a logical stop-loss area for those considering a position. Always align position sizing with overall portfolio risk tolerance.
Technical Analysis Overview
According to ChartMill’s detailed technical report, SOFI earns a perfect rating of 10/10 for technical health, reflecting strong trends across multiple timeframes and high relative performance. The setup rating is 6/10, indicating a decent consolidation pattern with reduced volatility and clear support levels. For a more detailed look into the technicals, you can review the full report here.
Exploring Similar Opportunities
For investors interested in finding more stocks that fit this high-growth, technically sound profile, our predefined screen combines Minervini’s Trend Template with strict fundamental growth filters. You can access the screen and explore current candidates here.
Disclaimer: This article is for informational and educational purposes only and does not constitute investment advice. All investment decisions should be based on your own research, risk tolerance, and financial goals. Please read our full disclaimer here.