
In this article we will dive into SUPER MICRO COMPUTER INC (NASDAQ:SMCI) as a possible candidate for growth investing. Investors should always do their own research, but we noticed SUPER MICRO COMPUTER INC showing up in our strong growth, ready to breakout screen, which makes it worth to investigate a bit more.
Growth Examination for SMCI
To evaluate a stock's growth potential, ChartMill utilizes a Growth Rating on a scale of 0 to 10. This comprehensive assessment considers various growth aspects, including historical and estimated EPS and revenue growth. SMCI has achieved a 8 out of 10:
- The Earnings Per Share has grown by an nice 18.77% over the past year.
- Measured over the past years, SMCI shows a very strong growth in Earnings Per Share. The EPS has been growing by 66.56% on average per year.
- The Revenue has grown by 110.42% in the past year. This is a very strong growth!
- The Revenue has been growing by 33.76% on average over the past years. This is a very strong growth!
- The Earnings Per Share is expected to grow by 27.61% on average over the next years. This is a very strong growth
- Based on estimates for the next years, SMCI will show a quite strong growth in Revenue. The Revenue will grow by 9.60% on average per year.
A Closer Look at Health for SMCI
ChartMill assigns a Health Rating to every stock. This score ranges from 0 to 10 and evaluates the different health aspects like liquidity and solvency, both absolutely, but also relative to the industry peers. SMCI scores a 6 out of 10:
- SMCI has an Altman-Z score of 7.42. This indicates that SMCI is financially healthy and has little risk of bankruptcy at the moment.
- SMCI's Altman-Z score of 7.42 is amongst the best of the industry. SMCI outperforms 90.63% of its industry peers.
- A Debt/Equity ratio of 0.28 indicates that SMCI is not too dependend on debt financing.
- SMCI has a Current Ratio of 6.38. This indicates that SMCI is financially healthy and has no problem in meeting its short term obligations.
- The Current ratio of SMCI (6.38) is better than 96.88% of its industry peers.
- SMCI has a Quick Ratio of 3.73. This indicates that SMCI is financially healthy and has no problem in meeting its short term obligations.
- The Quick ratio of SMCI (3.73) is better than 96.88% of its industry peers.
Exploring SMCI's Profitability
Discover ChartMill's exclusive Profitability Rating, a proprietary metric that assesses stocks on a scale of 0 to 10. It takes into consideration various profitability ratios and margins, both in absolute terms and relative to industry peers. Notably, SMCI has achieved a 7:
- Looking at the Return On Assets, with a value of 14.85%, SMCI belongs to the top of the industry, outperforming 90.63% of the companies in the same industry.
- SMCI has a better Return On Equity (23.16%) than 87.50% of its industry peers.
- With a decent Return On Invested Capital value of 16.62%, SMCI is doing good in the industry, outperforming 71.88% of the companies in the same industry.
- The Average Return On Invested Capital over the past 3 years for SMCI is above the industry average of 16.52%.
- The last Return On Invested Capital (16.62%) for SMCI is well below the 3 year average (20.63%), which needs to be investigated, but indicates that SMCI had better years and this may not be a problem.
- SMCI has a Profit Margin of 6.94%. This is in the better half of the industry: SMCI outperforms 75.00% of its industry peers.
- SMCI's Profit Margin has improved in the last couple of years.
- In the last couple of years the Operating Margin of SMCI has grown nicely.
Why is SMCI a setup?
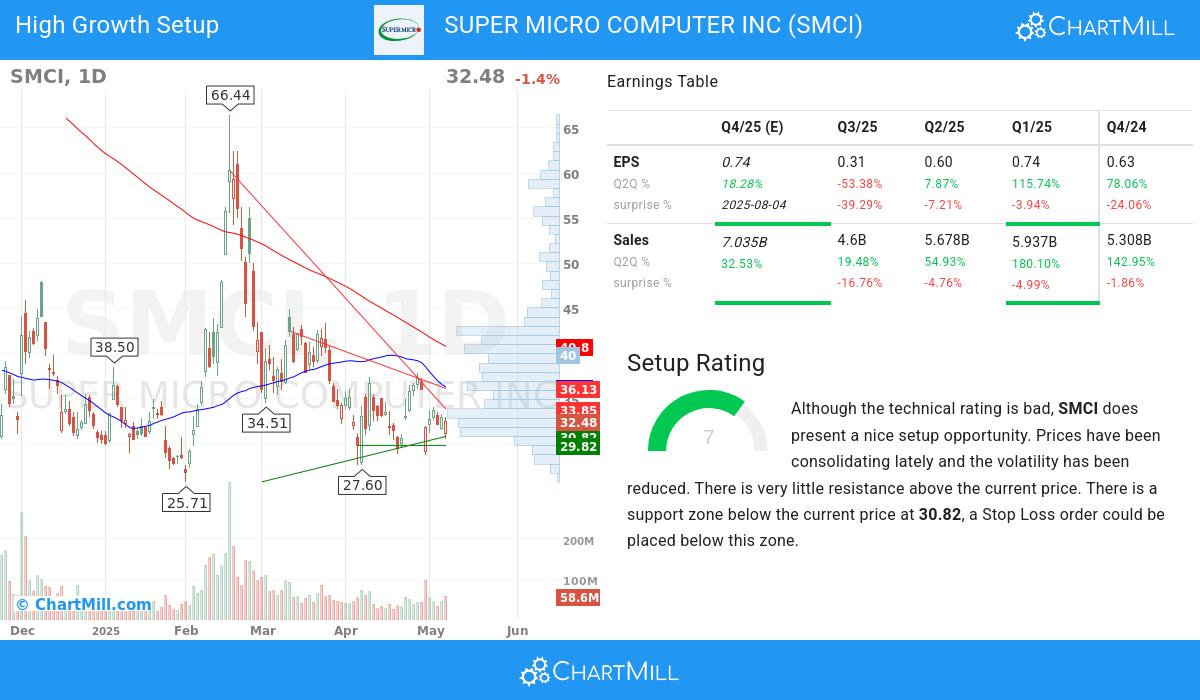
ChartMill incorporates a Setup Rating in its analysis, which measures the extent of consolidation in a stock over recent days and weeks. This rating, ranging from 0 to 10, is updated daily and takes into account multiple short-term technical indicators. The current setup rating for SMCI is 7:
SMCI has a bad technical rating, but it does show a decent setup pattern. Prices have been consolidating lately and the volatility has been reduced. There is very little resistance above the current price. There is a support zone below the current price at 30.82, a Stop Loss order could be placed below this zone.
More Strong Growth stocks can be found in our Strong Growth screener.
For an up to date full fundamental analysis you can check the fundamental report of SMCI
Our latest full technical report of SMCI contains the most current technical analsysis.
Keep in mind
This article should in no way be interpreted as advice. The article is based on the observed metrics at the time of writing, but you should always make your own analysis and trade or invest at your own responsibility.