
For investors looking to profit from active market possibilities, a method that combines solid fundamental expansion with interesting technical formations can be especially effective. This method requires finding companies that are not only increasing their earnings and sales at a quick rate but are also showing price movement that indicates a possible continuation of that rising trend. By selecting for stocks with strong growth scores, good financial condition, and acceptable profitability, and then adding a technical study that finds helpful chart formations, investors try to locate possibilities where fundamental force and market timing come together. The aim is to identify companies set for more increase as their expansion narrative receives wider market acceptance, shown by a technical move upward from a time of sideways movement.
SHOPIFY INC - CLASS A (NASDAQ:SHOP) stands as a leading example for this method. As a worldwide commerce platform supplying the necessary systems for businesses of every size to function online, Shopify works in a huge and growing target market, a key qualitative factor for lasting expansion. The company's tools allow merchants to handle sales across web, mobile, social media, and physical stores, placing it at the heart of the continuing digital shift of retail.
Fundamental Growth Driver
The center of the investment case for Shopify exists in its outstanding growth path, which is numerically confirmed in its fundamental analysis report. The company receives a high-level Growth Score of 9 out of 10, doing much better than most of its counterparts in the IT Services field.
- Rapid Historical Growth: Over the last year, revenue jumped by 30.25%, while the five-year average yearly revenue increase remains at a notable 41.27%. Profit growth has been even more impressive, with a 70.21% average yearly EPS increase over recent years.
- Good Future Projection: This speed is forecast to persist, with experts predicting average yearly EPS increase of 21.54% and revenue increase of 23.59% in the next years. This continuing high growth is a vital standard, as it shows the company's enlargement is built-in and not a single occurrence.
- Supporting Fundamentals: While the growth narrative is most important, it is supported by an outstanding Financial Health Score of 9. The company has no debt, very good liquidity measures (Current and Quick Ratios of 3.93), and a high-level Altman-Z score, showing very low failure risk and sufficient means to support future enlargement. Its Profitability Score of 6 shows a change, with good profit and operating margins that have gotten better lately, displaying the company's capacity to turn growth into profits.
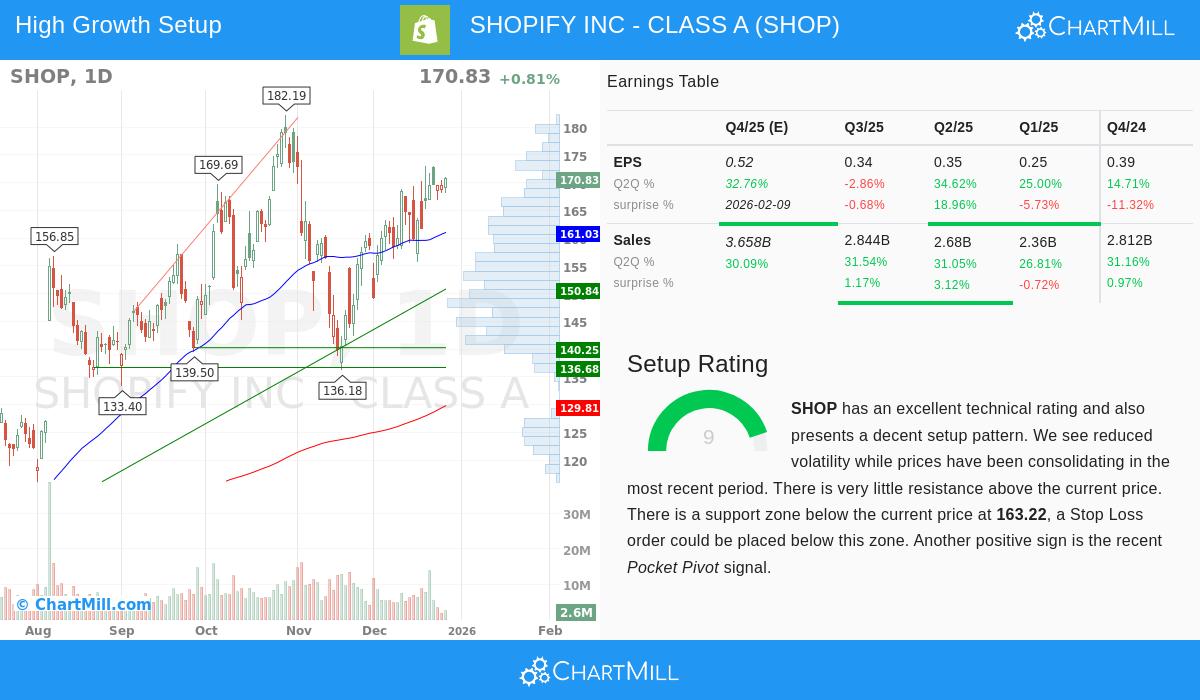
Technical Move Upward Formation
The fundamental force is reflected in the stock's price movement. Shopify's technical analysis report gives a complete score of 10, backed by a high Formation Score of 9, which specifically searches for positive chart patterns.
- Forceful Trend Agreement: Both the near-term and long-term trends are clearly positive. The stock is trading above all main moving averages (20, 50, 100, and 200-day SMAs), and these averages are themselves in rising arrangements, a traditional sign of kept positive momentum.
- Sideways Movement and Possible Move Upward: The stock has been trading inside a set band over the last month. It is now nearing the top edge of this band, close to a main horizontal resistance point. A clear move above this area could indicate a new phase of rising, a pattern the filter is made to find.
- Forceful Comparative Results: Shopify is doing better than 91% of all stocks on a yearly basis and displays a similar level of better performance inside its own field. This comparative force implies the market is valuing its fundamental advance.
Valuation Points
It is notable that high growth frequently carries a higher price. Shopify's Valuation Score of 2 shows this fact, with measures like a P/E ratio much above the wider market average. For growth investors, this higher price is often taken in exchange for the quicker expansion rates. The main question is if the company's growth speed can support and later grow into its present price, a point where its good future projections become a central part of the study.
Summary
Shopify offers an interesting case where a forceful fundamental growth story meets a technically positive chart formation. The company leads a big and enlarging market, shows rapid and forecast continued enlargement in sales and profits, and keeps a very strong balance sheet. Technically, the stock is in a clear upward trend and is placing itself near a point that could start a notable move upward. This mix is exactly what the "Strong Growth Stocks with good Technical Formation" filtering method tries to discover.
For investors wanting to examine other stocks that fit this mix of good growth fundamentals and hopeful technical formations, you can see the full filter standards and its present outcomes here.
Disclaimer: This article is for information only and does not make financial guidance, a suggestion to buy or sell any security, or a support of any investment plan. The study is based on data and reports given by ChartMill.com. Investors should do their own complete research, think about their personal money situation and risk comfort, and talk with a registered financial consultant before making any investment choices. Past results are not a guide for future outcomes.