
For investors aiming to find major upside, a mixed method of fundamental and technical study can be a strong tactic. The aim is to find companies with good basic business growth—strong revenue and earnings increases, firm financial condition, and acceptable profitability—that are also near a technical price move. This combination indicates a stock is not only sound in its basics but is also receiving favorable market movement, possibly marking the beginning of a new upward price move. One stock now matching this description is SHOPIFY INC - CLASS A (NASDAQ:SHOP).
A Fundamental Driver of Outstanding Growth
Centrally, Shopify supplies the needed systems for trade, enabling businesses of every scale to function on the internet and in person. The company's basic view is led by very fast growth, which is the main driver for any growth stock. As shown in ChartMill's fundamental analysis report, Shopify gets a high Growth Rating of 9 out of 10.
- Revenue Growth: The company has shown a very firm historical growth path, with revenue rising by an average of 41.27% each year over recent periods. In the last year, revenue increased by a notable 30.25%.
- Earnings Expansion: Earnings per share (EPS) growth is also strong, with a 70.21% average yearly growth rate previously and a 15.65% rise over the most recent year.
- Future Outlook: Experts anticipate this good growth to persist, with expected yearly EPS growth of 21.54% and revenue growth of 23.59% in future periods.
This outstanding growth picture is vital for the tactic, as it finds a company increasing its market position and growing its activities quickly—a main trait of winning growth investments.
Supporting Basics: Condition and Profitability
While growth is most important, longevity counts. A firm growth stock must also have the financial strength to fund its increase. Shopify's basics show firmness in these supporting fields:
- Financial Condition: The company has a very good Health Rating of 9/10. It carries no debt and has a very firm cash position, with a Current Ratio and Quick Ratio both at 3.93, showing sufficient means to cover near-term needs and fund prospects. Its Altman-Z score of 51.87 points to very low bankruptcy danger.
- Profitability: Shopify has reached steady profitability, with positive earnings and operating cash flow in four of the past five years. Its Profit Margin of 16.65% is higher than 94% of its IT Services industry competitors. The company gets a Profitability Rating of 6/10, showing area for betterment but a firm base as it grows.
These elements meet the "acceptable profitability and health" filter of the scanning tactic, making sure the company's growth is set on a steady financial footing instead of high borrowing or cash loss.
The Valuation Factor
An examination of Shopify would be unfinished without noting its valuation, which gets a low 2/10 in the fundamental report. The stock sells at high earnings multiples, with a P/E ratio of 122 and a Forward P/E of 86.9. This is common for fast-growth companies where investors pay a high price for future earnings possibility. While this raises the danger, the tactic allows this in return for high growth rates, expecting that the company's increase will in time support the high price.
Technical Movement Supporting the Narrative
A firm fundamental narrative becomes more attractive when the market price behavior starts to match. Shopify's technical analysis report gives a high rating of 8/10, stating a "consistent performance in both the short and longer term time frames."
- Favorable Trends: Both the long-term and short-term trends for SHOP are now positive, a good state for movement.
- Firm Relative Performance: The stock has done better than 86% of the market over the past year and 82% of its industry rivals, showing clear strength.
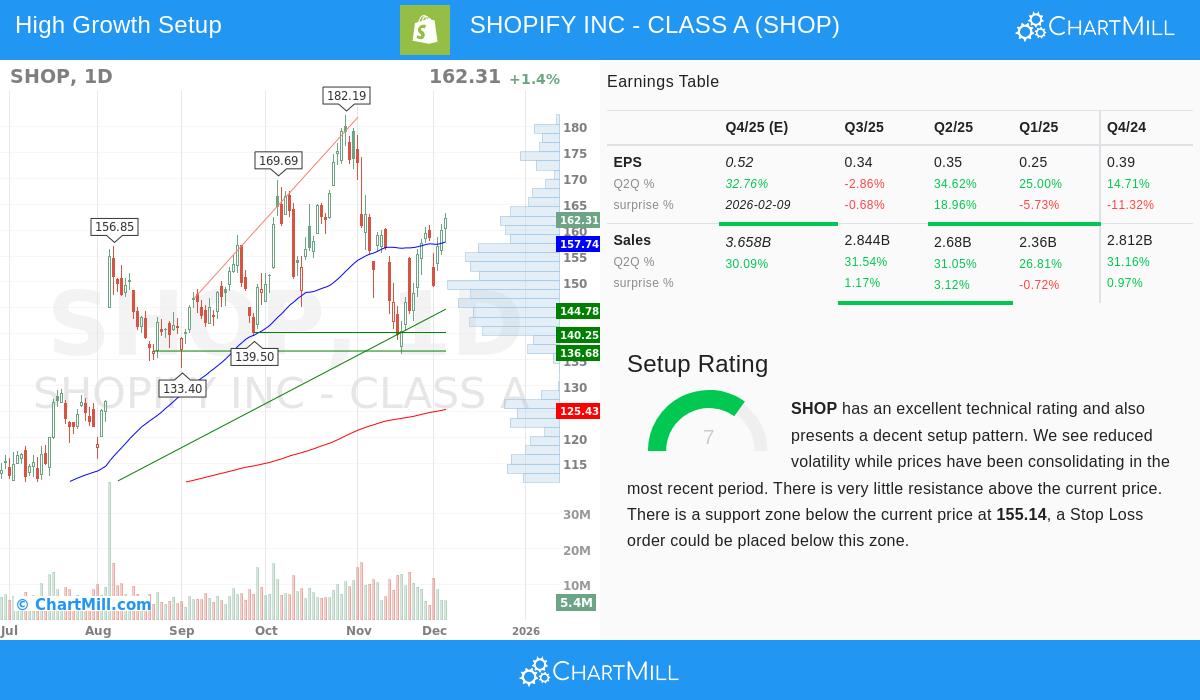
- Consolidation and Position: The report notes a good technical position (Rating: 7), stating that prices have been steadying lately with lower price swings. The stock is selling near the top of its one-month band, with very little price barrier above the present price and a set support area below. This formation often comes before a possible price move, where the stock could rise to new highs if buying interest grows.
This technical view is exactly what the scanning method looks for: a basically firm growth stock that is also showing helpful price behavior, hinting at large buyer interest and a possible preparation to rise.
Conclusion
Shopify shows an example of the mixed fundamental and technical method. The company displays the signs of a standard growth stock: outstanding historical and expected increase in revenue and earnings, backed by a very firm balance sheet with no debt. While its valuation is high, this is often the exchange for reaching such high growth rates. Importantly, the technical study shows the stock is not stalled; it is in a positive trend, displaying firm relative performance, and is steadying in a way that often comes before a new upward phase.
For investors curious about this method, the stock was found using a "Strong Growth Stocks with good Technical Setup Ratings" scan. You can locate more possible choices that fit this mixed growth-and-movement outline by reviewing the set scan here.