
When investors look to find promising growth stocks that also show favorable technical entry points, they frequently use strategies that mix fundamental and technical analysis. This method joins the forward-looking possibility of solid financial growth measures with the timing benefits given by technical breakout patterns. By searching for companies showing strong revenue and earnings growth along with good profitability and financial stability, while also displaying bullish technical setups, investors try to capture stocks ready for both short-term momentum and continued long-term gain.
SHOPIFY INC - CLASS A (NASDAQ:SHOP) appears as an interesting candidate under this method, showing the signs of a solid growth stock while displaying a positive technical pattern. The company, which offers a cloud-based commerce platform for businesses of all sizes, works in a growing market as e-commerce and digital retail solutions keep gaining ground worldwide.
Fundamental Strength and Growth Metrics
Shopify's fundamental profile shows several traits that match the growth investing strategy. The company has shown impressive financial growth, with fundamental study pointing to solid past growth and good future outlook.
Key growth measures include:
- Revenue growth of 28.98% over the last year
- Earnings per share growth of 28.85% each year
- Expected revenue growth of 22.74% each year based on forward estimates
- Projected EPS growth of 21.38% per year going forward
These growth rates are much higher than industry averages and back the company's label as a true growth stock. The fundamental health rating of 8/10 points to good financial stability, with no existing debt and solid liquidity ratios. While the valuation seems high with a P/E ratio over 100, this is common for high-growth companies where investors are ready to pay more for future growth potential.
Technical Breakout Pattern
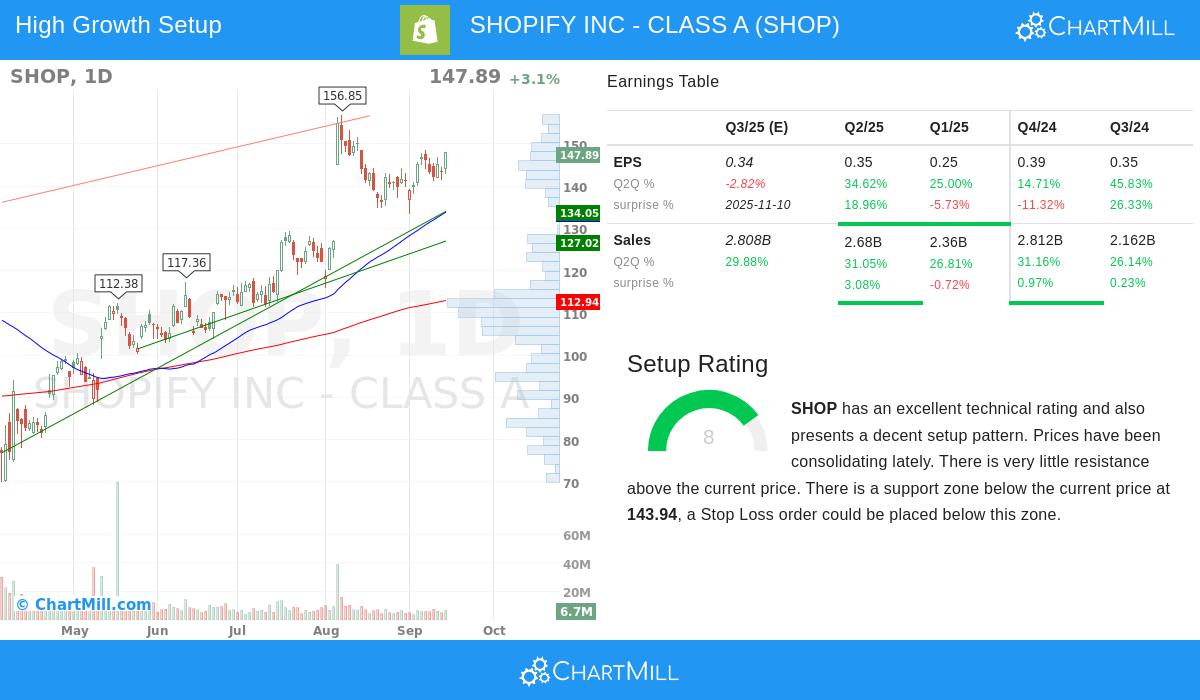
From a technical view, Shopify presents a positive setup that matches its solid fundamental story. The stock now shows both short-term and long-term upward trends, trading near the top of its recent range. The technical study shows a consolidation pattern that often comes before notable price moves.
Notable technical traits:
- Price consolidation between $133.40 and $148.57 over the last month
- Trading near the high of this range, hinting at possible breakout
- Several support levels found below current price, giving downside protection
- Solid relative strength doing better than 93% of all stocks
- Increasing moving averages across all timeframes (20-day, 50-day, 100-day, and 200-day)
The setup indicates that a breakout above the recent resistance might lead to more upward momentum, making the present technical arrangement especially notable for momentum-focused investors.
Alignment with Growth Investing Principles
Shopify's profile fits well with the main ideas of growth investing covered in our opening context. The company works in the growing e-commerce platform market, which stands for a big target audience as businesses more and more move online. This large addressable market gives the scalability that growth investors look for.
The company keeps its competitive edge through ongoing platform improvement and growth of services, from payment processing to shipping solutions. Management has shown the skill to adjust to shifting market conditions while keeping a clear view for long-term growth. These qualitative factors, joined with the quantitative growth measures, make a full growth investment case.
Risk Considerations
While the mix of solid fundamentals and technical setup seems interesting, investors should stay mindful of several points. The high valuation allows little space for execution errors, and any drop in growth rates could greatly affect the stock price. Also, as a company that puts profits back into growth instead of paying dividends, Shopify draws mainly investors looking for capital gain rather than income.
The technical setup, while positive, needs careful risk control. The suggested stop loss below support levels gives defined risk measures, but investors should watch the trade closely given the stock's past volatility.
For investors interested in looking into similar chances that join solid growth fundamentals with positive technical setups, more screening results can be found through our Strong Growth Stocks with Good Technical Setup Ratings screen. This tool regularly finds companies meeting these specific criteria, offering a useful resource for growth-focused investors looking for technically confirmed entry points.
Disclaimer: This analysis is for informational purposes only and does not constitute investment advice, a recommendation, or an offer to buy or sell any securities. Investors should conduct their own research and consult with a qualified financial advisor before making investment decisions. Past performance is not indicative of future results.