
Investors aiming to benefit from the next group of market leaders frequently use a two-part method, joining the prospective focus of fundamental analysis with the timing clues from technical patterns. One specific tactic involves searching for solid growth stocks that are also showing encouraging technical breakout formations. The reasoning is simple: find firms with sound and improving business basics, like earnings growth, profitability, and financial condition, and then search for times when the stock's price movement indicates a possible conclusion to a period of sideways movement and the start of a new rising trend. This technique tries to match the caliber of the business with a positive time for investment, aiming to join the next phase of a growth narrative.
Sprouts Farmers Market Inc (NASDAQ:SFM) offers an interesting example for this investment method. The specialty grocer, recognized for its emphasis on fresh, natural, and organic goods, runs more than 440 stores in the United States. Initially, its recent stock performance has been difficult, trading much lower than its 52-week peaks during a generally positive broader market. Yet, a closer examination of its fundamental condition and the present technical formation shows the exact standards that cause it to be notable in a tactical search for solid growth stocks with a technical formation.
Fundamental Strength: The Engine for Growth
The foundation of this tactic is finding companies with lasting growth potential and good financials. According to ChartMill's fundamental analysis report, Sprouts receives a total rating of 7 out of 10, with very good scores in two important categories: Profitability (9/10) and Financial Health (8/10). These ratings are not vague numbers, they come from specific financial measures that point to a high-caliber business.
- Exceptional Profitability: Sprouts' margins are a main advantage. The company has a Profit Margin of 5.93% and an Operating Margin of 7.84%, each performing better than almost 90% of similar companies in the Consumer Staples Distribution & Retail industry. Significantly, these margins have been getting better in recent years. Its Return on Invested Capital (ROIC) of 15.78% is not only good but has been rising, showing efficient use of capital to create profits.
- Solid Financial Health: The company's balance sheet is strong. With a very low Debt/Equity ratio of 0.04 and an Altman-Z score showing no bankruptcy danger, Sprouts displays very good solvency. Importantly, its Debt to Free Cash Flow ratio is only 0.12, meaning it could pay off all its debt with less than two months of its cash flow. This financial strength offers stability and the ability to finance future growth.
- Confirmed and Projected Growth: The "Growth" rating of 7/10 is backed by notable recent results and good forecasts. Over the last year, Earnings Per Share (EPS) increased by 49.42%, and Revenue grew by 16.60%. For the future, analysts estimate yearly EPS growth of 16.28% and Revenue growth of 10.63% over the next years. This mix of strong past results and a believable future growth path is exactly what growth investors look for.
Valuation: A Reasonable Price for Quality
Growth investing involves the danger of paying too much for future promise. Sprouts' valuation measures indicate the market may not be completely valuing its quality. The stock trades at a P/E ratio of 15.40 and a Forward P/E of 13.69, which is less expensive than over 70% of its industry peers and notably under the present S&P 500 average. When considering its high profitability and expected growth rate, the valuation seems fair, possibly appealing, offering a potential buffer for investors.
Technical Setup: The Pattern of Potential
While fundamentals explain the "why," technical analysis can help find the "when." Despite a low total technical rating because of its negative long-term and short-term trends, Sprouts' chart displays a specific formation that matches the search tactic: a period of sideways movement within a set range, happening before a possible breakout.
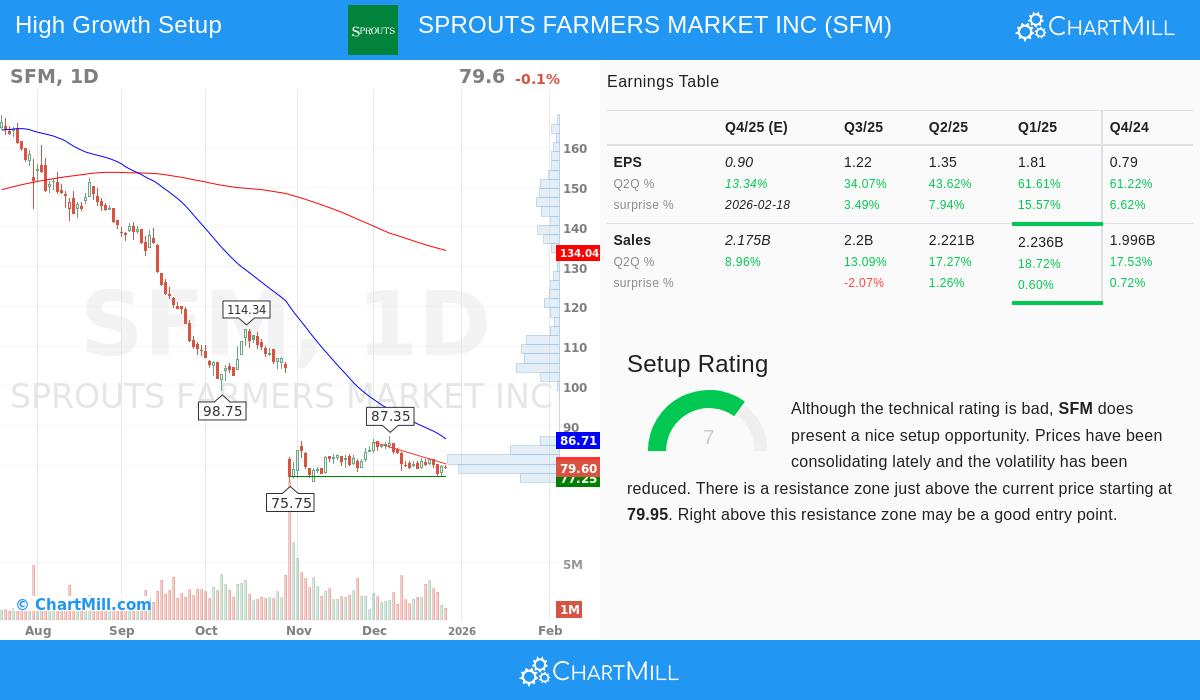
According to the technical analysis report, Sprouts has been trading between about $77.25 and $87.35 over the last month, with reduced price swings. It is presently trading near the bottom of this range and its 52-week lows. The report gives a Setup Rating of 7 out of 10, stating that "prices have been consolidating lately and the volatility has been reduced."
- The Setup Explained: This period of sideways movement, after a sharp drop, can indicate a time of balance where selling is being taken in. For a breakout tactic, the important level to observe is the nearby resistance area, marked between $79.95 and $80.42. A clear move above this resistance on greater-than-normal volume could signal that new buying interest is appearing, possibly marking the finish of the downtrend and the start of a new recovery stage.
- Why It Matters for the Strategy: The tactic specifically searches for such formations in fundamentally sound stocks. The idea is that the excellent business fundamentals supply the base for a lasting recovery. The technical formation then provides a defined, lower-risk entry point, using the breakout level as a confirmation signal that momentum could be changing, instead of trying to predict the exact lowest point.
Conclusion
Sprouts Farmers Market represents the kind of opportunity this combined tactic tries to find: a company with clearly good fundamentals, first-rate profitability, a strong balance sheet, and good growth, that is trading at a fair price but has seen major price decline. The present technical view shows it is moving sideways after this drop, forming a possible breakout above the $80 resistance level. For investors, this presents a situation where the fundamental narrative is unchanged and even getting better, while the chart gives a clear level to watch for a possible change in market opinion.
Interested in examining other stocks that match this profile of solid growth paired with an encouraging technical formation? You can perform the same search using our Strong Growth Stock Technical Setups Screener to find more possible opportunities.
Disclaimer: This article is for informational and educational purposes only and does not constitute investment advice, a recommendation, or an offer or solicitation to buy or sell any securities. The analysis presented is based on data and reports provided by third parties. Investors should conduct their own independent research and consider their individual financial circumstances and risk tolerance before making any investment decisions. Past performance is not indicative of future results.