
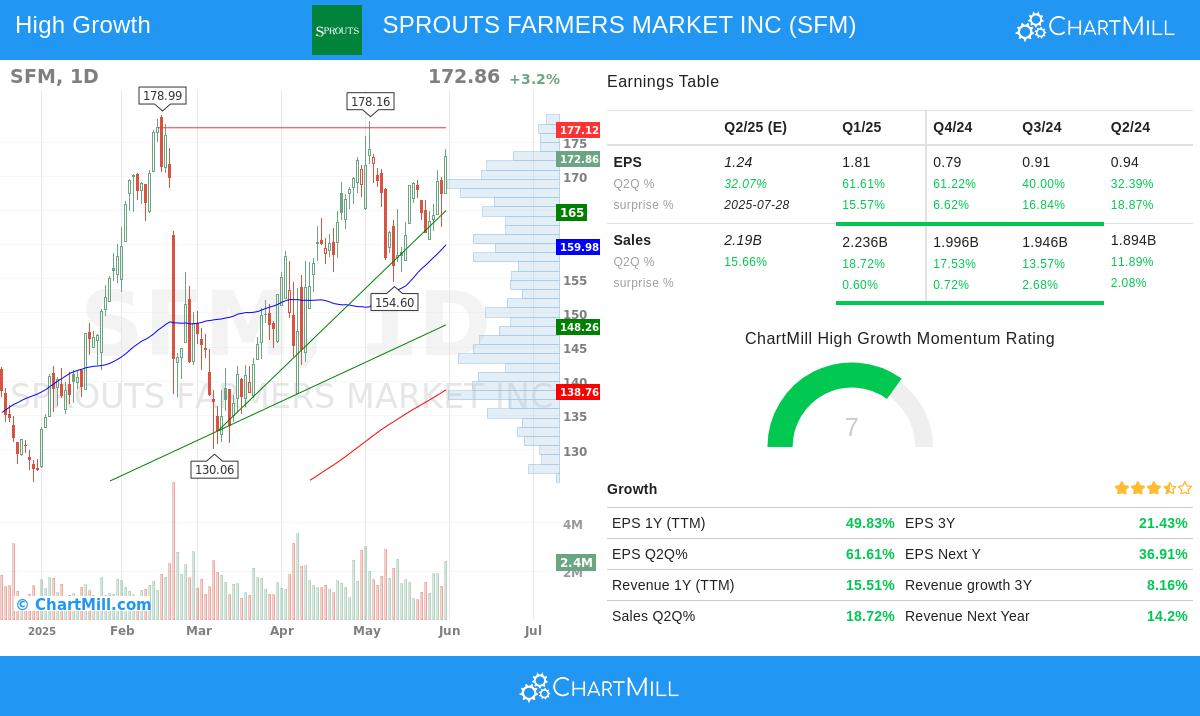
SPROUTS FARMERS MARKET INC (NASDAQ:SFM) has been identified as a high-growth momentum stock that aligns with Mark Minervini’s Trend Template. The company operates a chain of health-focused grocery stores, emphasizing organic and natural products. SFM demonstrates strong technical and fundamental characteristics, making it a candidate for further analysis by growth-oriented investors.
Why SFM Fits the Minervini Trend Template
Minervini’s strategy focuses on stocks exhibiting strong uptrends with specific technical criteria. SFM meets these requirements:
-
Price Above Key Moving Averages:
- Current price ($172.86) is above the 50-day ($159.98), 150-day ($149.62), and 200-day ($138.76) moving averages.
- The 50-day MA is above both the 150-day and 200-day MAs, confirming bullish momentum.
-
Upward-Trending Averages:
- The 150-day and 200-day MAs are rising, indicating sustained long-term strength.
-
Price Relative to 52-Week Range:
- Trading within 3.4% of its 52-week high ($178.99).
- Up 133% from its 52-week low ($74.15), showing strong recovery and momentum.
-
High Relative Strength:
- SFM’s relative strength score is 96.89, meaning it outperforms nearly 97% of all stocks.
Growth Fundamentals Supporting the Case
Beyond technical strength, SFM exhibits robust growth metrics:
-
Earnings Growth:
- EPS (TTM) grew 49.8% year-over-year.
- Quarterly EPS growth accelerated to 61.6% in the most recent quarter.
- EPS revisions for next year are up 19.6% over the past three months.
-
Revenue Expansion:
- Revenue (TTM) increased 15.5% year-over-year.
- Quarterly sales growth was 18.7%, with consistent beats on estimates.
-
Profitability Improvements:
- Profit margins expanded to 8.05% in the latest quarter, up from 3.99% a year ago.
- Free cash flow per share surged 91.1% over the past year.
Technical Outlook
According to ChartMill’s technical report, SFM scores a perfect 10 on technical health, with both short-term and long-term trends positive. The stock is consolidating near resistance at $177.12, presenting a potential breakout opportunity. Support levels are well-defined, with key zones around $166.94 and $159.98.
For a deeper technical breakdown, review the full technical analysis report here.
Our High Growth Momentum + Trend Template screener lists more stocks with similar growth and technical strength.
Disclaimer
This is not investment advice. The observations are based on current data, but market conditions can change. Always conduct your own research before making investment decisions.