
The method used to find possible investment choices joins a strict technical system with attention to fundamental growth momentum. This method is based on the ideas of Mark Minervini, a well-known trader whose plan stresses purchasing stocks that are already in strong upward moves and are supported by improving business fundamentals. The technical base is his Trend Template, a list made to sort for stocks showing firm, multi-timeframe momentum. This is combined with a filter for high growth momentum (HGM), which looks for companies showing outstanding and frequently speeding growth in earnings and sales. The aim is to locate securities where better price strength is supported by basic business strength, matching technical leadership with fundamental gain.
A Firm Technical Base: Matching the Minervini Trend Template
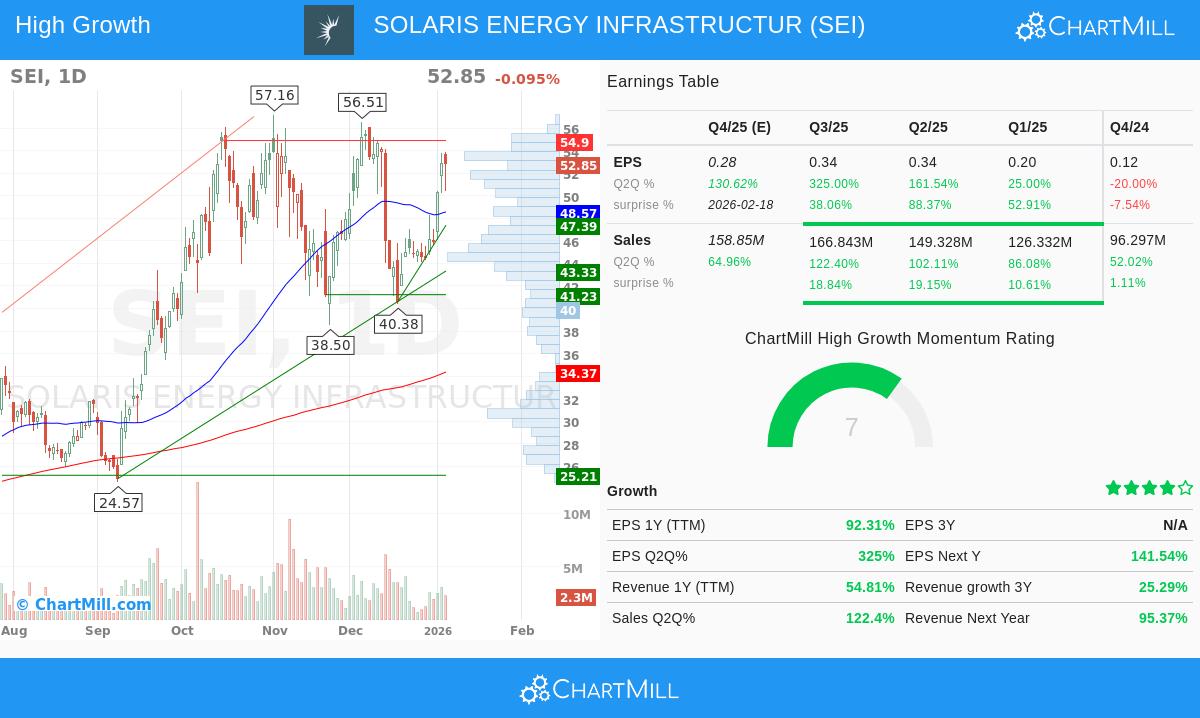
For a stock to be reviewed under the Minervini method, it must first pass a fixed group of technical conditions that verify a firm and set uptrend. Solaris Energy Infrastructure (NYSE:SEI) now matches these important measures, which are created to make sure an investor is only involved in stocks where the momentum is clearly favorable for buyers.
- Price Above Important Moving Averages: The stock's last price of $52.85 trades well above its 150-day ($38.58) and 200-day ($34.37) simple moving averages (SMAs). This is a main need, showing the long-term trend is good.
- Rising Long-Term Averages: Both the 150-day and 200-day SMAs are increasing, confirming continued buying over long times. The 200-day SMA, an important measure, has moved up from a past value of $34.22.
- Positive Moving Average Order: The shorter 50-day SMA ($48.57) is above both the 150-day and 200-day SMAs. This layered, rising order of averages (50 > 150 > 200) is a standard sign of a firm stage 2 upward move.
- Nearness to Highs: With a 52-week high of $57.17, SEI's present price is within 8% of its yearly top. Minervini's plan centers on strength, preferring stocks that are guiding the market and trading close to new highs instead of slower stocks looking for a low point.
- Major Comeback from Lows: The present price is about 270% above its 52-week low of $14.27, showing strong comeback momentum and a clear change from a resting phase to a moving phase.
- Better Relative Strength: Maybe most key, SEI has a ChartMill Relative Strength (CRS) score of 92.93. This means it has done better than over 92% of the market in price action over the past year. High relative strength is a key part of the plan, finding market leaders that often keep leading.
This combination of technical points indicates SEI is in a clear stage 2 uptrend, making it a suitable choice for more study under the Minervini system. The template works as a quality screen, removing stocks with poor or uncertain trends.
The Fundamental Driver: Passing as a High Growth Momentum Stock
While a firm chart is necessary, Minervini notes that the largest gainers are nearly always backed by strong fundamental growth. The High Growth Momentum (HGM) score tries to find this by judging earnings and sales patterns. SEI's recent financial results show the type of fast growth that can draw large investor attention and support more price gains.
The company's earnings view is especially notable:
- Fast Quarterly Growth: The latest quarter saw earnings per share (EPS) jump 325% versus the same quarter last year. The quarter before also showed firm growth of over 161%.
- Positive Earnings Surprises: The company has exceeded analyst EPS guesses in 3 of the last 4 quarters, with an average beat of nearly 43%. Steady positive surprises often lead analysts to change future guesses higher, creating a cycle of rising hopes.
- Upward Estimate Changes: Showing more optimism, analysts have increased their earnings guesses for the next fiscal year by 37.4% over the past three months. This upward change is a key sign in the Minervini method, showing growing belief in the company's future.
- Firm Sales Growth: This earnings growth is not happening alone. Revenue for the last quarter grew 122% year-over-year, and the trailing twelve-month (TTM) revenue growth is a sound 55%. Also, revenue guesses for next year have been changed upward by 8.6%.
This pattern of speeding growth on both sales and profits is exactly what the HGM filter and the Minervini fundamental study try to find. It gives the "driver" that explains the firm technical performance, suggesting the price trend is built on a base of real business gain.
Technical Condition and Present Position
Beyond the Trend Template list, a wider view of SEI's technical condition is positive. According to ChartMill's own study, the stock gets a high Technical Rating of 8 out of 10, confirming its firm uptrend status. Both the long-term and short-term trends are rated as good, and the stock does better than 90% of its group in the Energy Equipment & Services industry.
The study does note, however, that the stock's Setup Rating is now a 3. This shows that after its major rise, the price has become stretched in the short term and is not giving a standard, lower-risk pause or "Volatility Contraction Pattern" (VCP) entry point at this time. For investors following the plan closely, this indicates waiting may be needed, looking for the stock to form a new base or move back in a constructive way to a key support area, such as the area between $46.98 and $47.53 where several moving averages and trendlines meet, before thinking about a new entry. You can see the full, detailed technical study for SEI here.
Locating Like Possibilities
Solaris Energy Infrastructure gives an example of a stock that matches a controlled growth and momentum plan, meeting needs on both technical trend strength and fundamental growth speed. For investors looking to filter for other choices that meet this joined standard of the Minervini Trend Template and High Growth Momentum, a set filter is ready. You can locate more possible results using this filter method here.
Disclaimer: This article is for information and learning only. It does not make investment advice, a suggestion, or an offer to buy or sell any security. The study is based on given data and certain methods, but past action is not a sign of future results. Investors should do their own study and think about their personal money situation and risk comfort before making any investment choice. Please read our full disclaimer here.