
In growth investing, joining a solid technical plan with detailed fundamental study can be an effective method for spotting possible market leaders. One example is the method used by well-known trader Mark Minervini, whose SEPA (Specific Entry Point Analysis) plan uses a step-by-step filter for stocks showing both firm price movements and improving business foundations. The aim is to locate firms not only rising in price, but those where outstanding profit and revenue growth create the reason for continued price gains. This two-part method aids investors in concentrating on strong performers, seeking to join during the initial parts of a stock's largest rises.
An important first step in the Minervini method is the Trend Template, a group of technical rules made to spot stocks in a verified Stage 2 upward movement. SOLARIS ENERGY INFRASTRUCTUR (NYSE:SEI) now shows a chart that matches many of these basic rules.
Match with the Minervini Trend Template
The Trend Template focuses on price trading above important moving averages with a particular positive order, and SEI's present technical position meets many of these points:
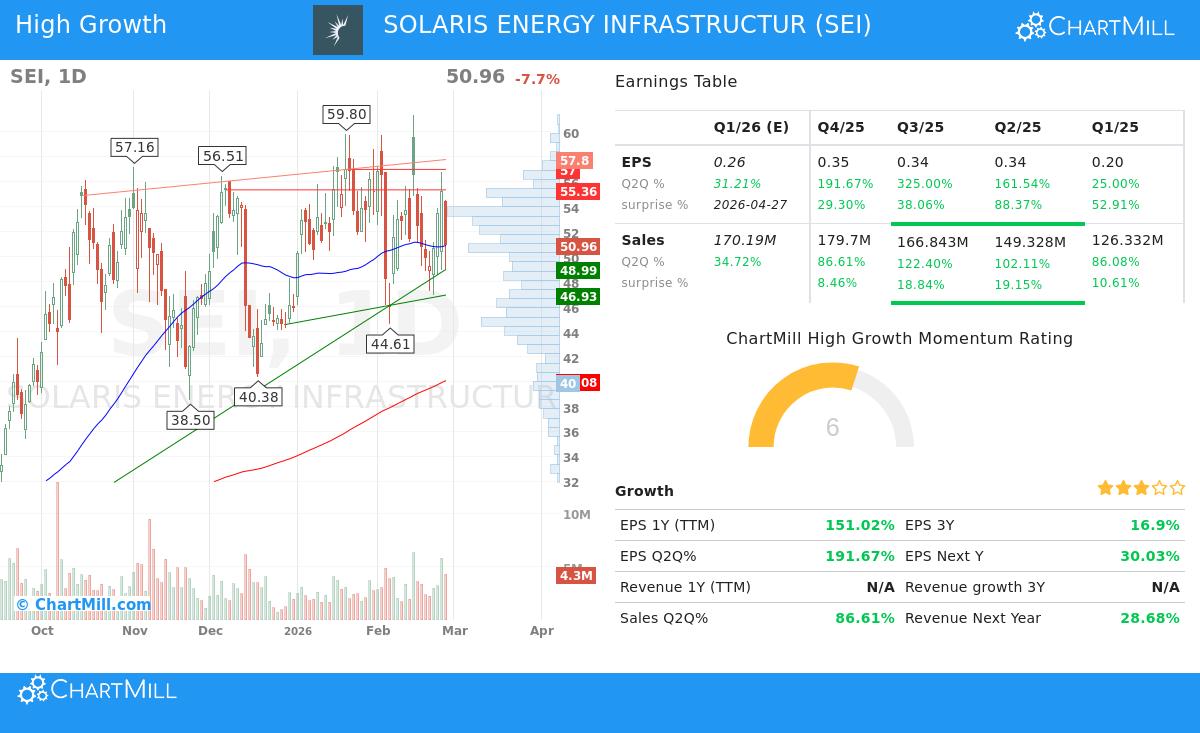
- Price Above Key Averages: The stock's last price of $50.96 is above its increasing 50-day ($50.91), 150-day ($44.16), and 200-day ($40.08) simple moving averages (SMAs). This order is vital for Minervini, as it shows the stock is in a long-term upward movement with firming medium-term speed.
- Moving Average Order: The 50-day SMA is above both the 150-day and 200-day SMAs, and the 150-day SMA is above the 200-day SMA. This step-by-step order of shorter-term averages above longer-term ones is a standard mark of a sound, set upward movement, showing steady buying interest across different periods.
- Nearness to Highs: A central idea of the plan is to focus on strength, not low points. SEI's price is about 257% above its 52-week low of $14.27, showing major recovery and speed. While it is now about 17% below its 52-week high of $61.36, it stays inside the wider idea of trading in the higher part of its yearly range, a trait of market leaders.
- Better Relative Strength: Maybe most key, SEI has a ChartMill Relative Strength (CRS) ranking of 83.1. This means it has done better than 83% of all stocks over the past year. Minervini strongly favors stocks with high relative strength (ideally above 80), as they are often the industry leaders that large funds buy during market rises.
These technical points together indicate SEI is working within a Stage 2 rise, the main phase where Minervini aims to put money. The template works as a quality screen, making sure one only looks at stocks where the existing direction of market feeling is favorable.
The Strong-Growth Fundamental Reason
While the Trend Template spots the how of a stock's move, the Minervini plan requires a strong why. This is where high-growth financials become important, acting as the possible reason for continued large fund interest and price increase. SEI's recent financial numbers show the type of fast growth that can draw such notice.
- Fast Profit Growth: The company's trailing twelve-month (TTM) EPS has increased by a large 151% year-over-year. Even more notable is the speed increase seen on a three-month basis. The latest three-month period saw EPS rise 192% compared to the same three-month period last year, after a 325% rise in the earlier three-month period. This sequence of speeding, three-figure profit growth is a sign of firms going through a strong operational change point.
- Firm Sales Speed: Revenue growth supports the profit increase. Sales in the last three-month period grew by 86.6% year-over-year, adding to a 122% increase in the three-month period before that. This shows firm need for Solaris's energy structure and logistics services.
- Positive Analyst Changes: The market's future expectations are also increasing. Analyst guesses for next year's EPS have been moved higher by over 25% in the last three months. Such upward changes are a key part of the Minervini method, as they often come before more large fund buying and show growing belief in the company's growth path.
- Steady Results: The company has exceeded EPS guesses in three of the last four three-month periods, with an average exceed of 43%. It has exceeded revenue guesses in all of the last four three-month periods. This record of beating guesses builds trust with investors.
For a strong-growth investor, this mix of speeding profits, firm sales growth, and rising analyst guesses forms an image of a company possibly reaching its strategic pace. In the Minervini structure, these financial strengths give the "fuel" that can maintain and push the technical upward movement spotted by the Trend Template.
Technical Condition and Position Review
Beyond the exact Trend Template rules, a wider view of SEI's technical condition gives setting. According to ChartMill's own study, the stock gets a Technical Rating of 6 out of 10. The note says that while SEI has been a strong performer over the past year, its very recent change shows some pause, with the short-term movement now neutral against a still-good long-term movement. The stock is trading in the higher part of its 52-week range, though it is a bit behind the wider S&P 500, which is near record highs.
Importantly, the study gives SEI a Setup Rating of 6, showing that after a major rise, the price has entered a period of holding. The note spots a clear support area near $49.23, suggesting a possible zone where buyers have before acted. For a trader using Minervini's ways, such a holding period after a strong move could be observed for a possible volatility squeeze pattern (VCP), which would give a new, lower-risk entry point on a later breakout.
You can see the full, itemized technical review for SEI through the ChartMill Technical Report.
Closing
SOLARIS ENERGY INFRASTRUCTUR shows a case where a detailed screening process finds a match with a strict growth plan. The stock fits the central technical needs of the Minervini Trend Template, trading in a long-term upward movement with better relative strength. Financially, it shows the type of fast, speeding profit and sales growth, supported by positive analyst changes, that can act as a reason for more price gains. While the stock is now holding some of its increases, which is seen in its neutral short-term movement, the basic high-growth story and set upward movement make it a notable candidate for investors using a trend-and-growth method to watch.
For investors looking to find other firms that fit this mix of firm technical movements and high-growth speed, more study can be done using the set screen: High Growth Momentum + Trend Template.
Disclaimer: This article is for information and learning only. It is not meant as investment guidance, a suggestion, or a plan to buy or sell any security. The study is based on given data and shows a particular method view. Investors should do their own full research, think about their personal money situation and risk comfort, and talk with a skilled money advisor before making any investment choices. Past results do not show future outcomes.