
For investors focused on chart patterns and momentum, a systematic method for spotting possible trades can be very useful. One such technique involves searching the market for stocks that show both good technical strength and a clear price pattern, indicating a possible breakout may be near. This method depends on two main proprietary measures from ChartMill: the Technical Rating, which judges the general condition and direction of a stock, and the Setup Quality Rating, which examines the consolidation pattern to spot a defined entry and exit point. By selecting for stocks with good scores in both areas, traders try to locate chances in strong stocks that are resting before their next possible move up. A recent scan using this method has pointed to RTX CORP (NYSE:RTX) as a notable candidate.
Technical Strength: A Base of Momentum
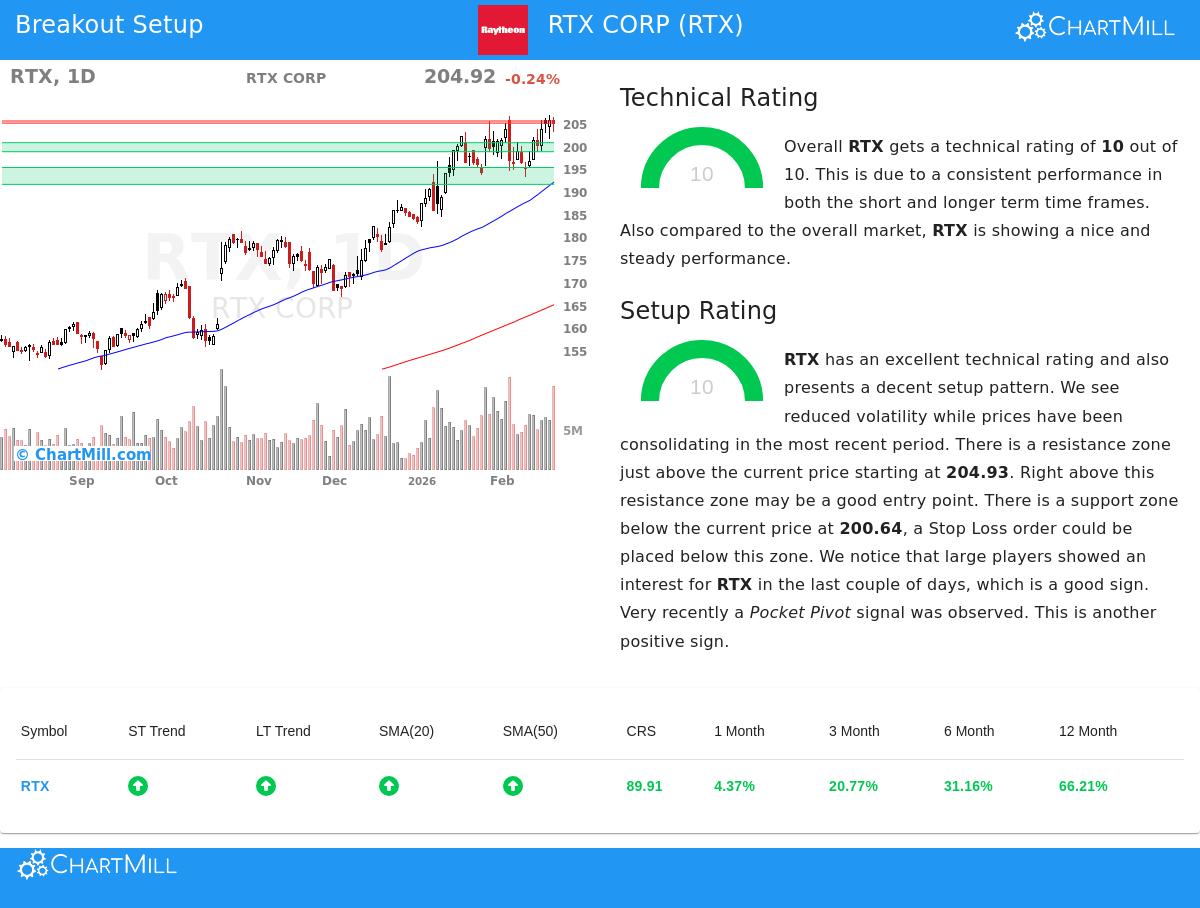
The first part of this breakout method is finding stocks with good underlying technicals, making sure the trade matches the current momentum. RTX Corp’s technical analysis report shows a perfect Technical Rating of 10 out of 10, putting it with the market's best. This high score comes from several strong points:
- Trend Alignment: Both the short-term and long-term trends for RTX are rated as positive. This agreement across timeframes is a clear sign of a good, continuing uptrend and lowers the chance of moves against the trend.
- Relative Outperformance: The stock is doing better than 89% of all stocks in the market over the last year, showing notable strength compared to the wider group. Its steady pattern of increasing prices further confirms its leading position.
- Position vs. Key Levels: RTX is now trading close to its 52-week high of $206.73. While the S&P 500 is also near highs, RTX's ability to hold this level shows it is matching or leading the general market momentum.
- Moving Average Support: The stock is trading above all its main simple moving averages (20, 50, 100, and 200-day), and each of these averages is itself in a rising pattern. This forms a stacked support structure below the price.
This very good technical background is important for the method because it directs focus to stocks that are already in clear uptrends. The aim is not to catch a falling knife or guess a bottom, but to take part in the continuation of an established move.
Setup Quality: Spotting the Entry Point
A strong trend by itself is not a buy signal; entering at a stretched point often results in quick pullbacks. The second part of the method handles this by looking for good consolidation patterns. RTX gets a perfect Setup Rating of 10, meaning a very good pattern is present.
- Consolidation Within an Uptrend: Over the last month, RTX has traded in a range between about $193 and $207. This time of consolidation after a prior rise lets the stock absorb its gains and form a new base of support.
- Defined Support and Resistance: The analysis finds a clear support area between $198.65 and $200.64, made from a mix of moving averages and trendlines. Just above the current price, a resistance area is between $204.93 and $205.42. These defined levels are needed for planning a trade with clear risk limits.
- Supportive Technical Signals: The report notes lower recent volatility and points out positive signals, including attention from large players (as measured by the Effective Volume indicator) and a recent "Pocket Pivot" signal, which hints at accumulation.
This good setup is what changes a strong stock into a possible trade. The consolidation gives a logical area for a stop-loss order (below support), while a move above resistance gives a clear sign that the consolidation may be finishing and the uptrend starting again.
A Possible Trading Plan
Based on this analysis, a specific, though only example, setup is shown. The proposed entry point is a buy-stop order at $205.43, just above the noted resistance area. A stop-loss order could be placed at $198.64, below the main support area. This plan states the risk at the start at about 3.3% on the trade. It is very important to note that this is an automatically created example from the data; traders must always do their own analysis, change levels to suit their personal risk comfort, and know about market events like earnings reports.
Locating More Chances
The scan that found RTX is run each day to find new possible breakout setups meeting these strict technical and setup rules. Investors looking for similar chances can view the current results using the Technical Breakout Setups screen.
Disclaimer: This article is for information only and does not make up investment advice, a recommendation, or an offer to buy or sell any security. The trading plan described is an automated, example case and not a suggestion. All investing and trading includes risk, including the possible loss of principal. Always do your own research and think about talking with a qualified financial advisor before making any investment choices. Past performance does not show future results.