
RTX CORP (NYSE:RTX) has been identified as a standout candidate in our technical breakout screen. The stock demonstrates strong technical health and a well-defined setup pattern, making it worth a closer look for investors focused on momentum and consolidation breakouts.
Technical Strength
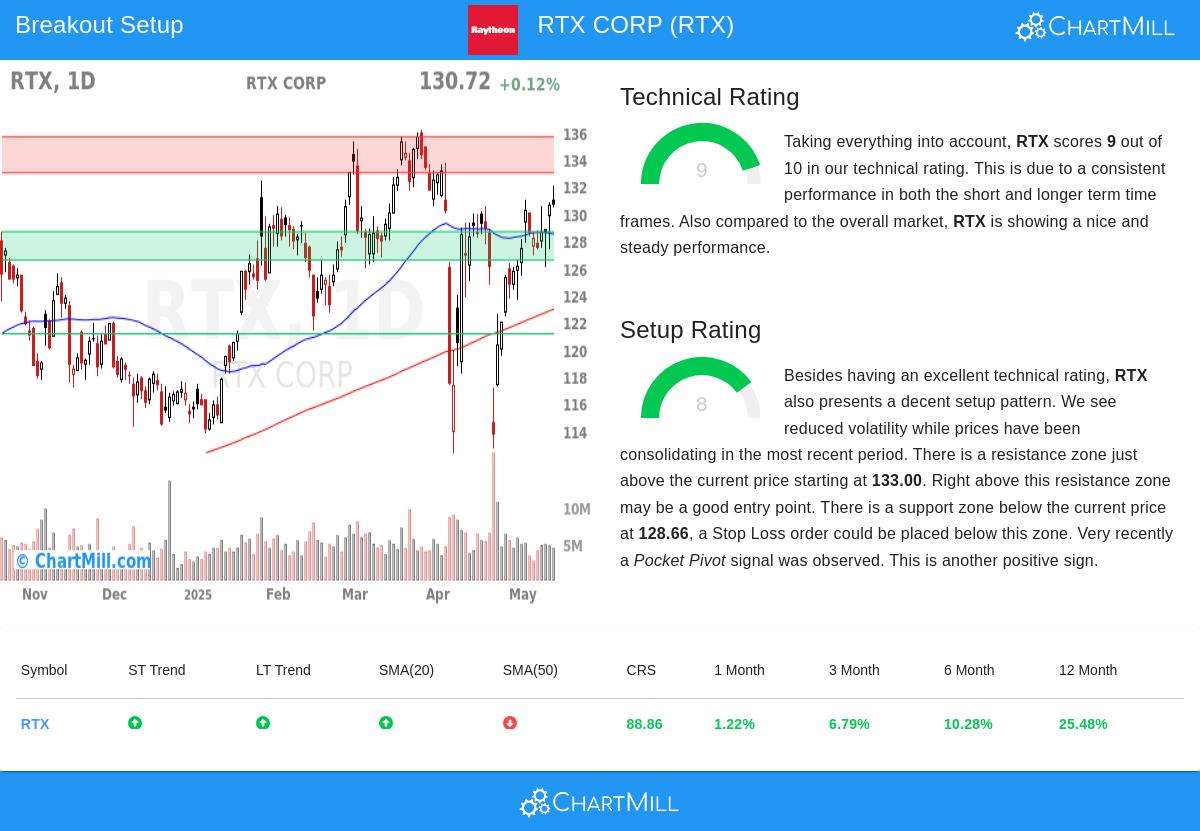
RTX currently holds a Technical Rating of 9 out of 10, reflecting its strong upward momentum. Key factors contributing to this score include:
- Positive Trends: Both short-term and long-term trends are upward, reinforcing the stock’s bullish stance.
- Relative Strength: RTX outperforms 88% of all stocks over the past year, with consistent gains spread across the period.
- Price Position: The stock is trading near the upper end of its 52-week range, aligning with the broader S&P 500’s performance.
- Moving Averages: The stock remains above key moving averages (20-day, 50-day, 100-day, and 200-day), confirming sustained buying interest.
Setup Quality
With a Setup Rating of 8, RTX presents a favorable consolidation pattern:
- Tight Trading Range: Recent price action has stabilized, reducing volatility and forming a clear support zone near $128.66.
- Resistance Breakout Potential: A resistance area sits just above the current price at $133.00, providing a potential entry point if the stock breaks higher.
- Pocket Pivot Signal: A recent accumulation pattern suggests institutional interest, adding further credibility to the setup.
For a deeper analysis, review the full technical report for RTX.
Our Technical Breakout Setups screener provides additional breakout candidates updated daily.
Disclaimer
This is not investment advice. Always conduct your own research and consider risk management before making trading decisions.