
The process of identifying stocks with high growth potential often involves a dual approach: finding strong technical trends and confirming basic fundamental strength. One organized method for this joins Mark Minervini's known Trend Template with a focus on strong-growth momentum. The Trend Template serves as a technical filter, making sure a stock is in a solid, confirmed uptrend by checking important moving average arrangements, price level compared to highs, and better relative performance. Adding a strong-growth momentum check then examines the company's financial performance, searching for quickening earnings, good sales growth, and favorable analyst changes. This pairing aims to find market leaders that are both technically good and supported by quickly getting better business foundations.
RUSH STREET INTERACTIVE INC (NYSE:RSI) appears as a candidate that meets this strict screening method, offering a case study in matching technical momentum with fundamental growth.
Meeting the Minervini Trend Template
The foundation of Minervini's strategy is trading in the direction of a verified, solid trend, specifically Stage 2 advances. The Trend Template's fixed rules are made to filter for exactly this. A look at RSI's chart and key numbers shows it meets these technical requirements:
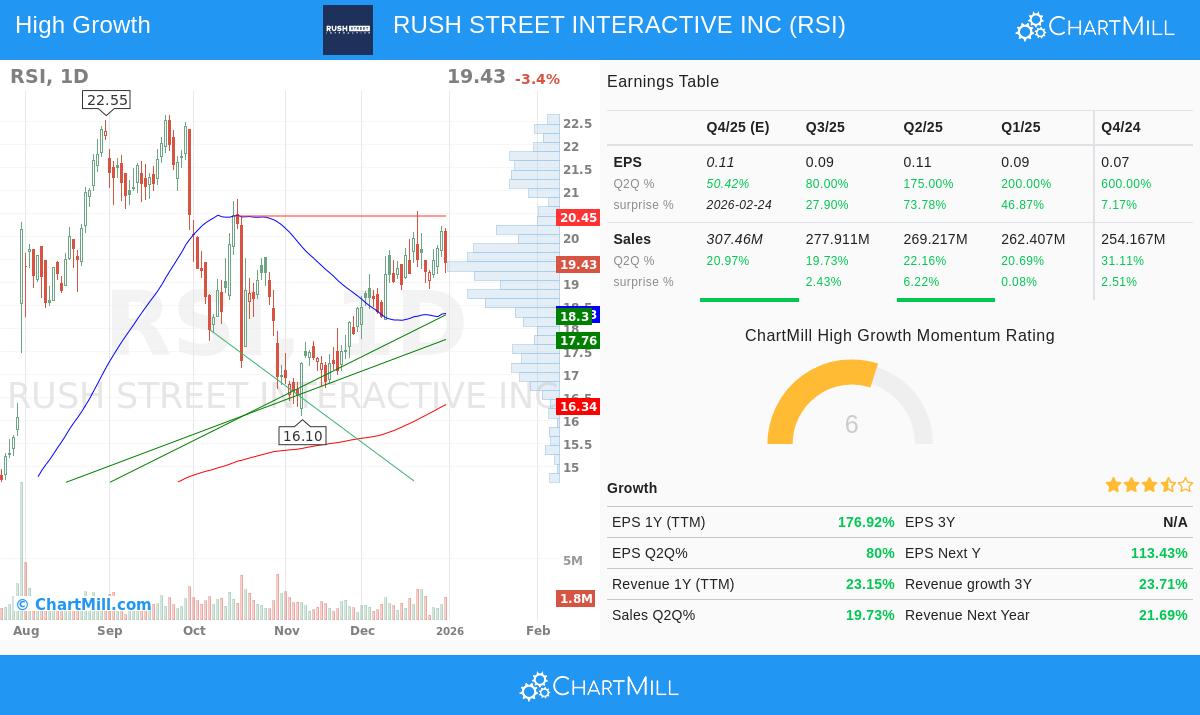
- Trend Arrangement: The stock's price is trading above its rising 50-day, 150-day, and 200-day simple moving averages (SMAs). Importantly, the 50-day SMA ($18.33) is above the 150-day SMA ($17.93), which is itself above the 200-day SMA ($16.34). This "stacked" order of shorter-term averages above longer-term ones is a standard sign of a good, working uptrend.
- Nearness to Highs: RSI's current price is more than 30% above its 52-week low and is trading within 25% of its 52-week high. This matches Minervini's focus on strength, preferring stocks that are showing momentum and leadership instead of those staying near lows.
- Better Relative Performance: With a ChartMill Relative Strength (CRS) score of 85.14, RSI is doing better than about 85% of all stocks in the market. High relative strength is a required part of the strategy, as it finds sector leaders and stocks being bought by institutional investors.
This technical view shows RSI is in a clear Stage 2 advance, the exact phase where Minervini's research shows the biggest gains are often made.
Qualifying for Strong Growth Momentum
While a good chart is necessary, Minervini's full SEPA® method stresses that the largest winners are almost always helped by outstanding fundamental growth. The strong-growth momentum check tests this part, and RSI's financial numbers show several strong positive points:
- High Earnings Growth: The company is showing notable profit increase. Earnings Per Share (EPS) growth on a trailing twelve-month (TTM) basis is at 176.9%. More notable is the quick speeding up seen in recent quarterly year-over-year comparisons, with past quarters showing growth rates of 200% and 600%.
- Steady Revenue Growth: Top-line growth is good and steady. Revenue grew 33.7% in the last full fiscal year, and recent quarterly year-over-year sales growth has been constant in the 19-22% range. This shows the company is effectively growing its operations.
- Favorable Analyst View: The average analyst estimate for next year's EPS has been changed upward by 7.93% over the last three months. Upward changes are an important sign in growth investing, often coming before more price gains as institutional expectations move higher.
- History of Exceeding Expectations: RSI has exceeded consensus EPS estimates in each of the last four quarters, with an average exceed of nearly 39%. This regular overperformance creates trust with the investment community and can be a reason for multiple growth.
These fundamental points give the "why" behind the stock's good technical performance. They suggest the price trend is being driven by real gains in business performance, a key connection that gives the technical move more staying power.
Technical Condition and Setup Summary
ChartMill's own analysis gives a combined view of RSI's technical position. The stock gets a high Technical Rating of 9 out of 10, showing its good long-term and short-term positive trends and better industry-relative performance. Adding to this, it has a Setup Rating of 8, showing the stock is in a pause phase within its uptrend, which can give a more clear, lower-risk entry point. The analysis finds a clear support area near $19.24, giving a sensible level for risk management.
For a complete look at the support and resistance levels, trend analysis, and a sample trade setup, readers can see the full ChartMill Technical Report for RSI.
Conclusion
RUSH STREET INTERACTIVE INC shows a profile that matches a strict growth-and-momentum investment method. It passes the technical check of the Minervini Trend Template, confirming it is in a solid uptrend and a market leader. At the same time, its fundamental profile, noted by high earnings growth, steady revenue gains, and favorable analyst changes, meets the rules for strong-growth momentum investing. This meeting of technical good points and fundamental speeding up makes RSI a stock deserving of more study for investors using such methods.
For investors looking for other candidates that meet this mix of technical trend good points and strong-growth fundamentals, the screening process that found RSI can be repeated using this High Growth Momentum + Trend Template screen.
,
Disclaimer: This article is for informational and educational purposes only. It is not a recommendation to buy or sell any security. The analysis is based on data provided and certain screening methodologies. All investing involves risk, including the potential loss of principal. Readers should conduct their own thorough research and consider their individual financial circumstances before making any investment decisions. Please read our full disclaimer here.