
For investors using technical analysis, finding stocks that are in a solid uptrend and making a positive price pattern is a key part of breakout trading methods. One organized method uses filters to find stocks that rate well on two specific measures: the ChartMill Technical Rating, which measures the general condition and direction of a stock, and the ChartMill Setup Quality Rating, which evaluates the state of its present pause pattern. The aim is to find stocks with sound technicals that are moving in a narrow band, hinting a possible breakout move could be near. RANGE RESOURCES CORP (NYSE:RRC) recently appeared from this filter, showing a picture that calls for more examination from a technical view.
Technical Strength: A High Ranking
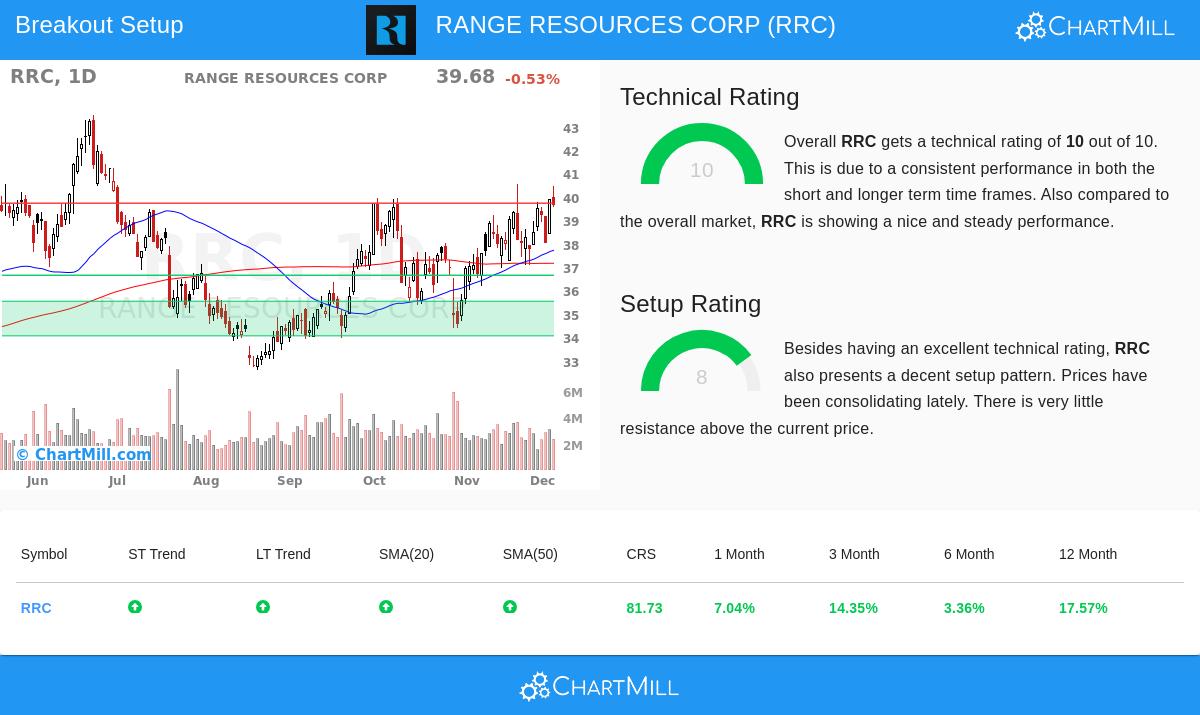
The base of any breakout candidate is a solid core trend. The ChartMill Technical Rating for RRC is a full 10 out of 10, putting it with the market's technical front-runners. This high mark is not given without reason; it shows steady force across several time periods and measures. A detailed look at the full technical report shows the supports of this force:
- Trend Agreement: Both the near-term and longer-term trends for RRC are marked as positive. This agreement is a strong sign, showing continued buying without notable opposing weakness.
- Relative Performance: The stock is doing better than 81% of all stocks in the market over the last year and 73% of similar companies in the Oil, Gas & Consumable Fuels field. This shows its force is not just from a climbing market but from particular, positive motion.
- Moving Average Support: The stock is priced above its important moving averages (20, 50, and 100-day), and these averages are themselves in rising arrangements. This forms a stacked support structure under the price.
- Price Location: RRC is priced in the higher part of its 52-week band, a common trait of stocks in set uptrends.
For the breakout method, a high Technical Rating is required. It answers the important first question: "Is this a stock worth buying?" A rating of 10 indicates RRC is not just in an uptrend, but is showing one of the most technically firm charts in the market, giving a positive setting for a possible breakout move.
Setup Quality: A Pause Before the Next Step
While a solid trend is needed, buying at the correct time is just as important. Entering a stock that is "stretched" or bought too much can lead to quick declines. This is where the Setup Quality Rating of 8 becomes important. This mark shows RRC has been pausing its recent advances, trading in a fairly narrow band and forming a base for its next possible rise.
Important notes from the technical report that back this setup are:
- Pause Band: Over the last month, RRC has traded between about $36.21 and $40.54. It is now testing the upper edge of this band.
- Set Resistance and Support: The report notes a clear resistance point at $39.73. A clear move above this point could signal the beginning of a new rise. On the other hand, it notes several support areas below, with the closest being between $34.06 and $35.54, giving a sensible zone for a protective stop-loss order.
- Low Overhead Supply: The study says there is "very little resistance above the present price," hinting that a breakout could meet little selling, allowing for a smoother move up.
This setup quality speaks directly to the second important question for traders: "When should I buy it?" The pause gives a clear reference point. The method usually involves placing a buy order just above the noted resistance ($39.74 in the report's example), waiting for the stock to show it has the motion to break out, with a stop-loss order placed below the recent pause to control risk.
A Possible Trading Plan
Based on the mix of these high ratings, the technical report describes a sample trade setup. It proposes an entry on a breakout above $39.74, with an exit stop at $37.06. This sets a risk of about 6.7% on the trade itself. It is important to know this is an example made from the study, not a suggestion. Every investor must decide their own entry, exit, and position size based on their personal risk comfort and plan.
Finding Like Chances
RRC shows the kind of chance the Technical Breakout filter is made to find: stocks with firm trends that are stopping in positive patterns. For investors wanting to see other present candidates that meet these strict technical and setup rules, the live filter is ready to view here.
Disclaimer: This article is for information only and does not form investment guidance, a suggestion, or an offer or request to buy or sell any securities. The study is based on technical measures and past data, which are not assurances of future results. Investing includes risk, including the possible loss of principal. Always do your own study and think about talking with a qualified financial advisor before making any investment choices.